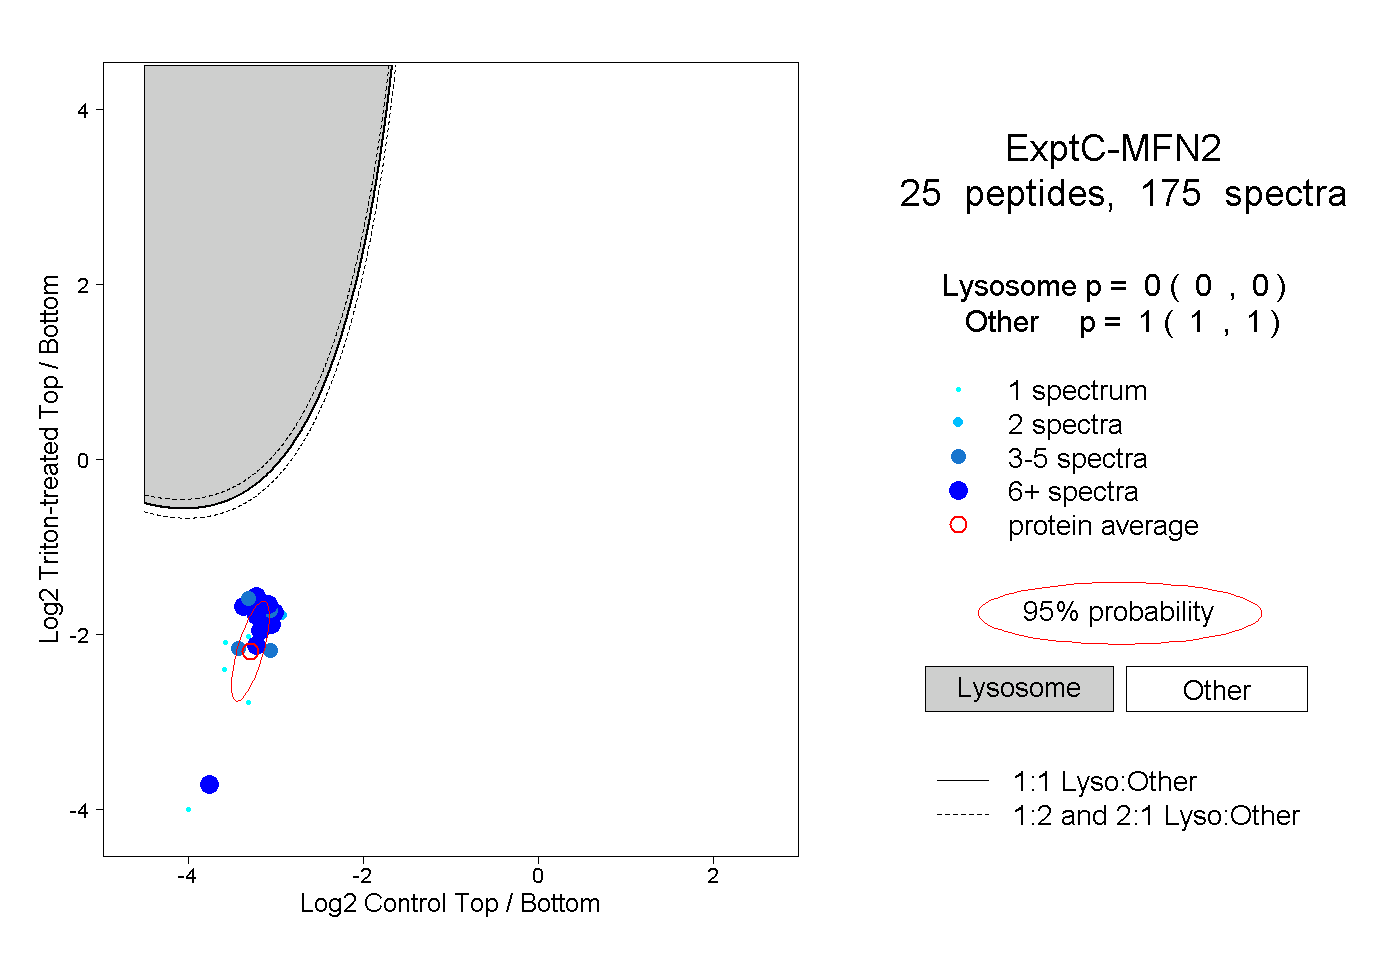
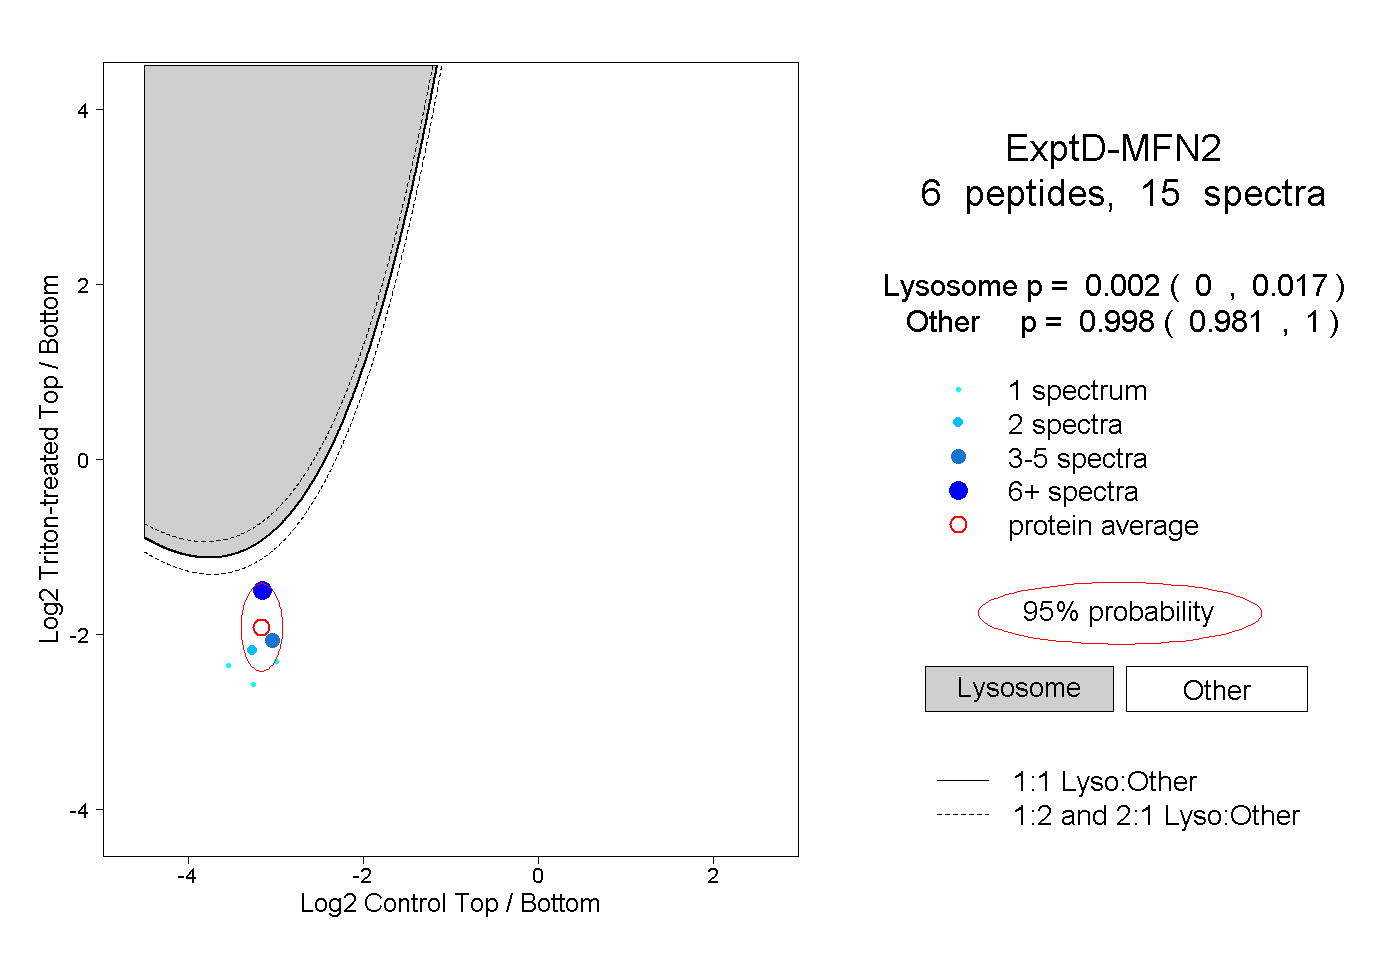
MFN2
[ENSRNOP00000059463]
Main page
| | | Plot |
Mito |
Lyso |
|
Perox |
ER |
Golgi |
PM |
Cytosol |
Nucleus |
|
| Expt A |
 14
14
peptides |
38
spectra |
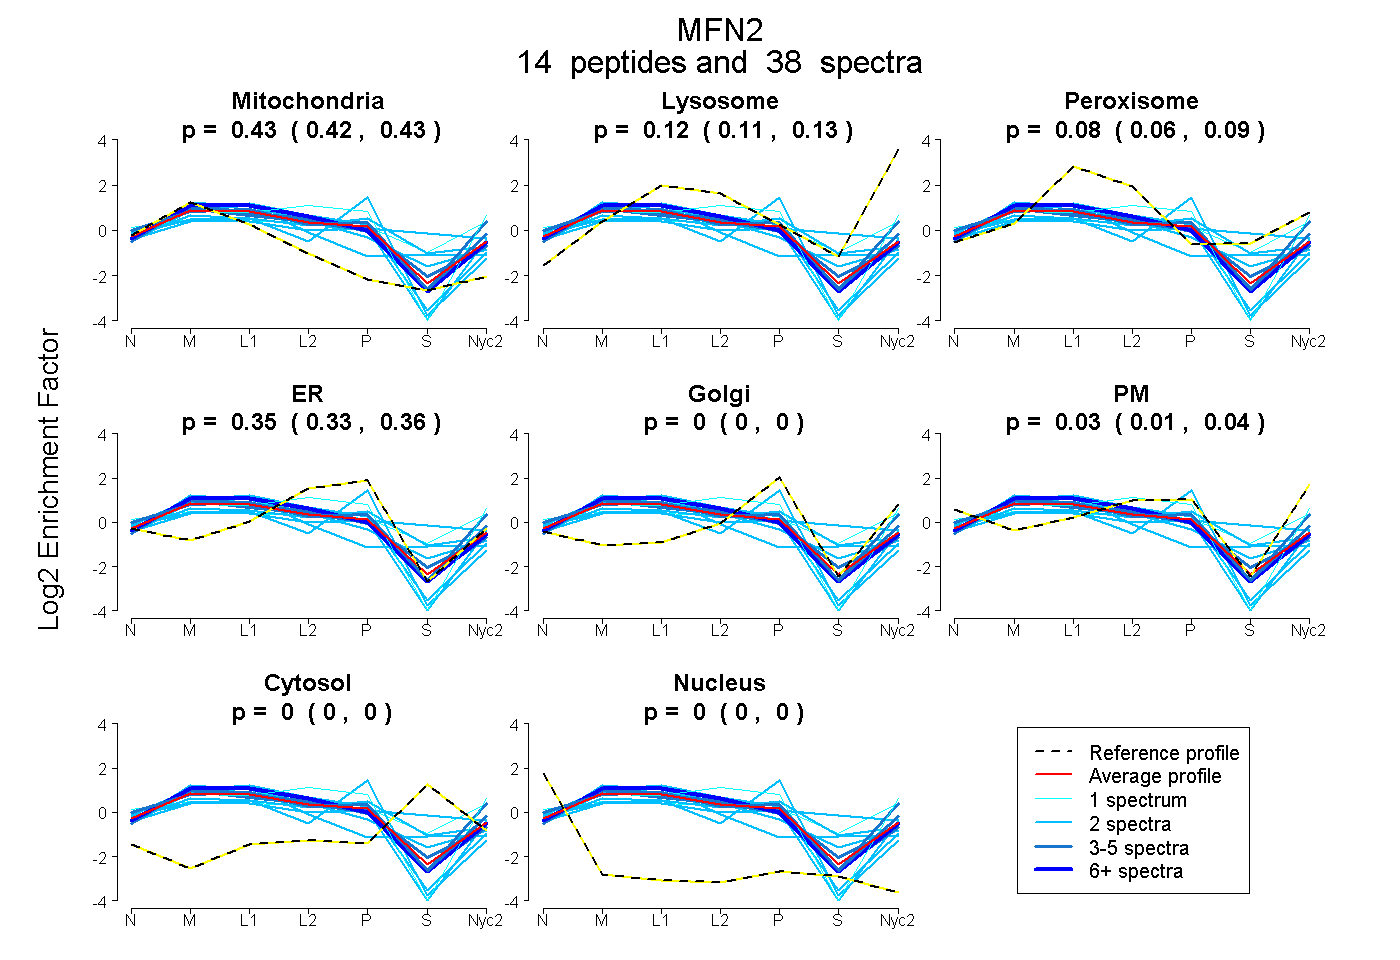 |
0.426
0.417 | 0.433 |
0.123
0.111 | 0.133 |
|
0.076
0.056 | 0.093 |
0.347
0.330 | 0.362 |
0.000
0.000 | 0.000 |
0.028
0.013 | 0.039 |
0.000
0.000 | 0.000 |
0.000
0.000 | 0.000 |
|
| | | Plot |
Mito |
|
Lyso or Perox |
|
ER |
Golgi |
PM |
Cytosol |
Nucleus |
|
| Expt B |
8
peptides |
20
spectra |
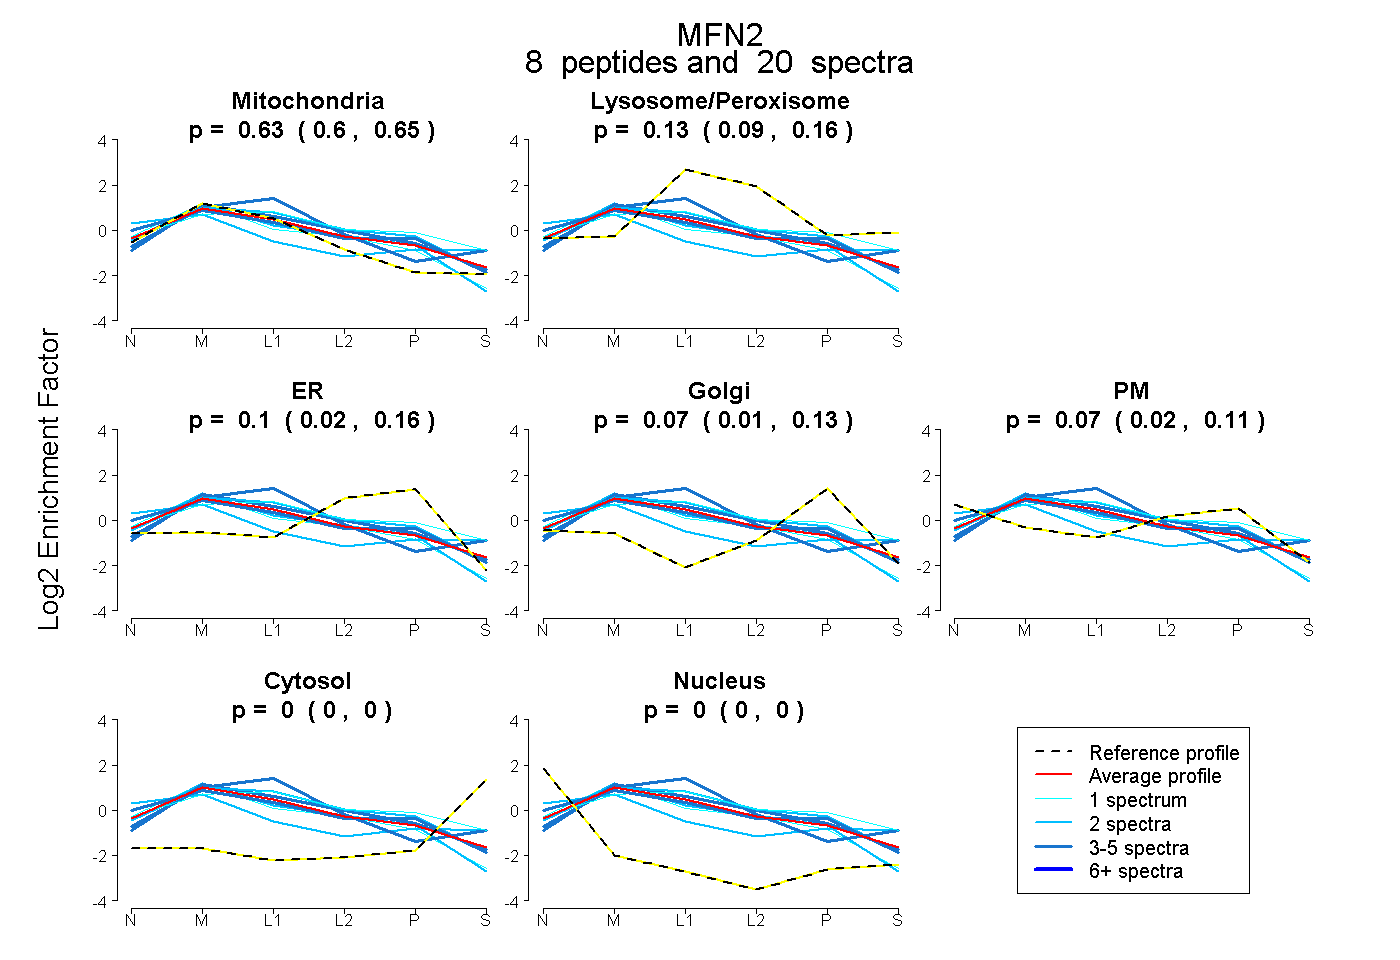 |
0.627
0.603 | 0.648 |
|
0.133
0.093 | 0.165 |
|
0.096
0.024 | 0.158 |
0.074
0.009 | 0.126 |
0.071
0.023 | 0.112 |
0.000
0.000 | 0.000 |
0.000
0.000 | 0.000 |
|
| 4 spectra, HIEEGLGR |
0.630 |
|
0.134 |
|
0.236 |
0.000 |
0.000 |
0.000 |
0.000 |
|
| 2 spectra, HFVTAK |
0.464 |
|
0.000 |
|
0.000 |
0.000 |
0.342 |
0.162 |
0.032 |
|
| 4 spectra, LLSFR |
0.653 |
|
0.320 |
|
0.000 |
0.000 |
0.000 |
0.027 |
0.000 |
|
| 1 spectrum, EVLSAR |
0.715 |
|
0.000 |
|
0.228 |
0.000 |
0.058 |
0.000 |
0.000 |
|
| 2 spectra, QIAEAVR |
0.560 |
|
0.164 |
|
0.276 |
0.000 |
0.000 |
0.000 |
0.000 |
|
| 4 spectra, VAFFGR |
0.534 |
|
0.063 |
|
0.063 |
0.000 |
0.340 |
0.000 |
0.000 |
|
| 2 spectra, GISEVLAR |
0.695 |
|
0.000 |
|
0.305 |
0.000 |
0.000 |
0.000 |
0.000 |
|
| 1 spectrum, QLELLAQDYK |
0.359 |
|
0.396 |
|
0.000 |
0.245 |
0.000 |
0.000 |
0.000 |
|
| | | Plot |
|
Lyso |
|
|
|
|
|
|
|
Other |
| Expt C |
25
peptides |
175
spectra |
 |
|
0.000
0.000 | 0.000 |
|
|
|
|
|
|
|
1.000
1.000 | 1.000 |
| | | Plot |
|
Lyso |
|
|
|
|
|
|
|
Other |
| Expt D |
6
peptides |
15
spectra |
 |
|
0.002
0.000 | 0.017 |
|
|
|
|
|
|
|
0.998
0.981 | 1.000 |