 43
43peptides
spectra
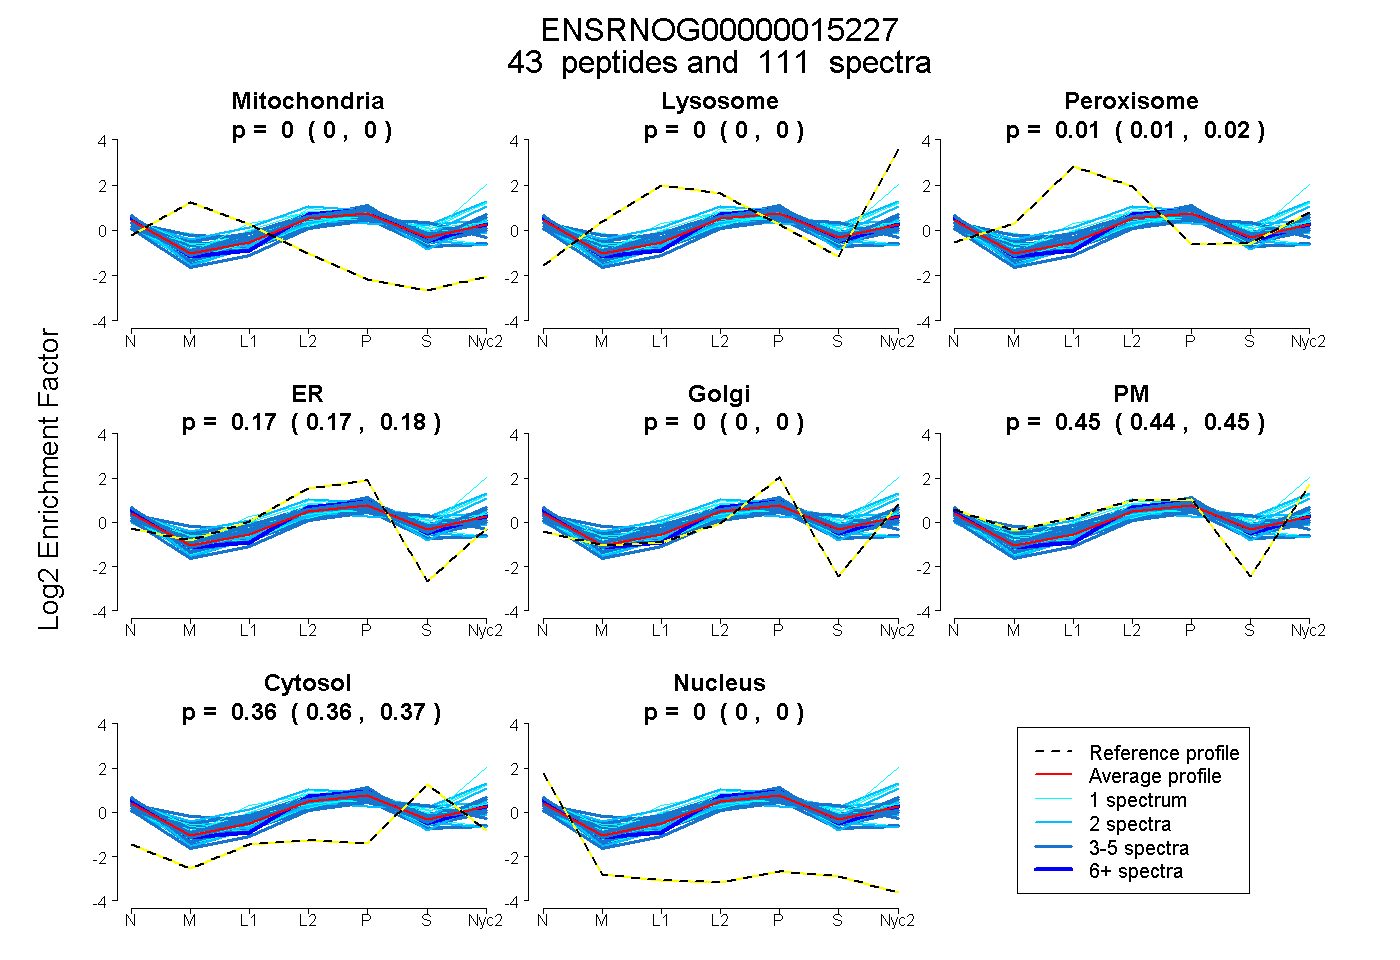
0.000 | 0.000
0.000 | 0.000
0.012 | 0.016
0.168 | 0.177
0.000 | 0.000
0.443 | 0.453
0.363 | 0.366
0.000 | 0.000
18peptides
spectra
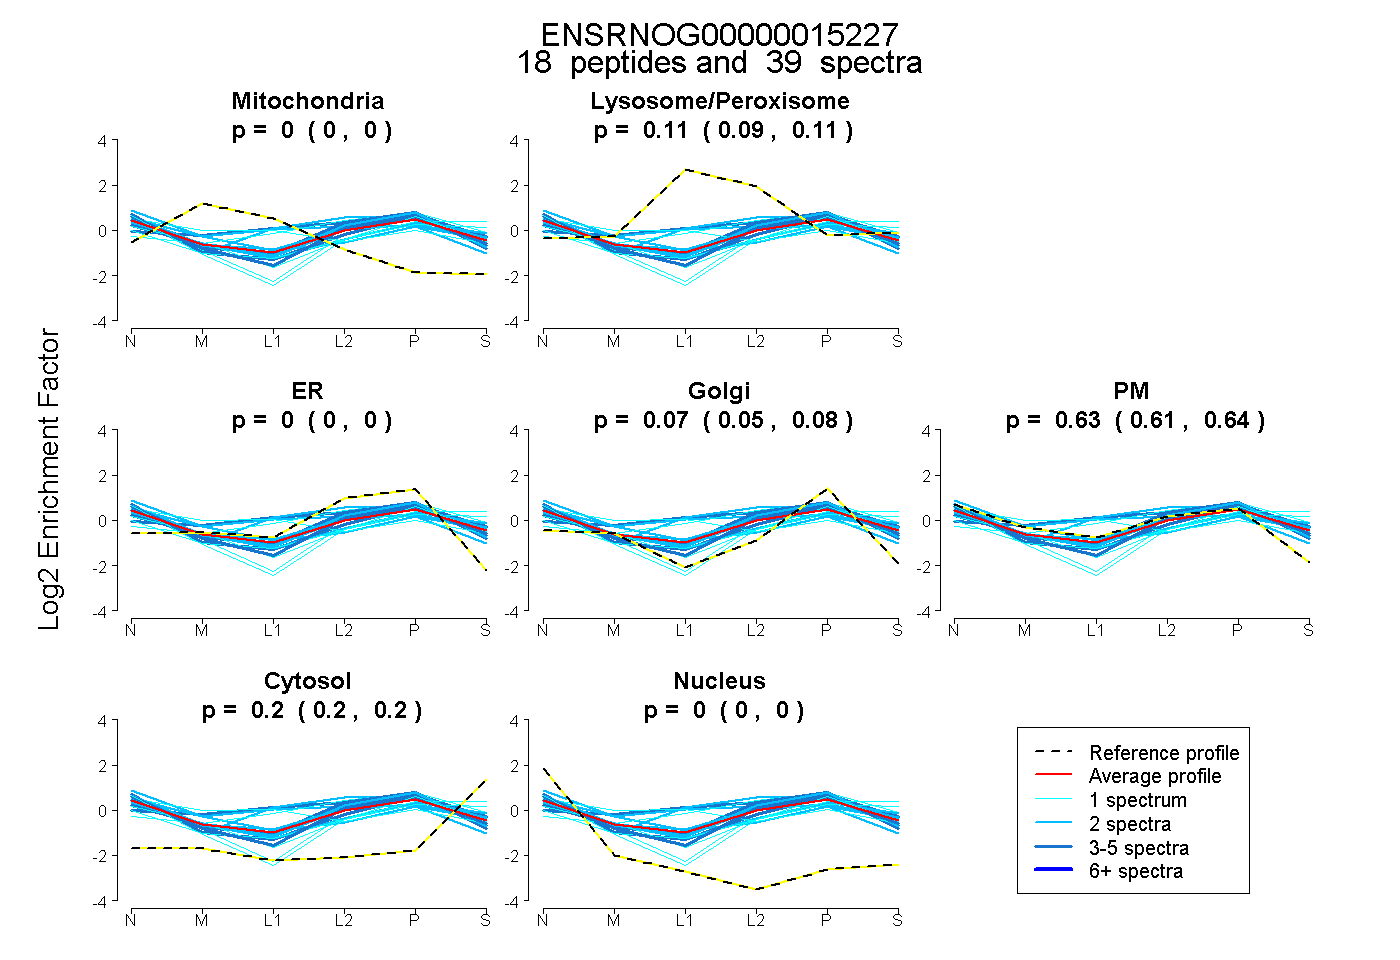
0.000 | 0.000
0.094 | 0.114
0.000 | 0.000
0.054 | 0.077
0.611 | 0.643
0.195 | 0.205
0.000 | 0.000
40peptides
spectra
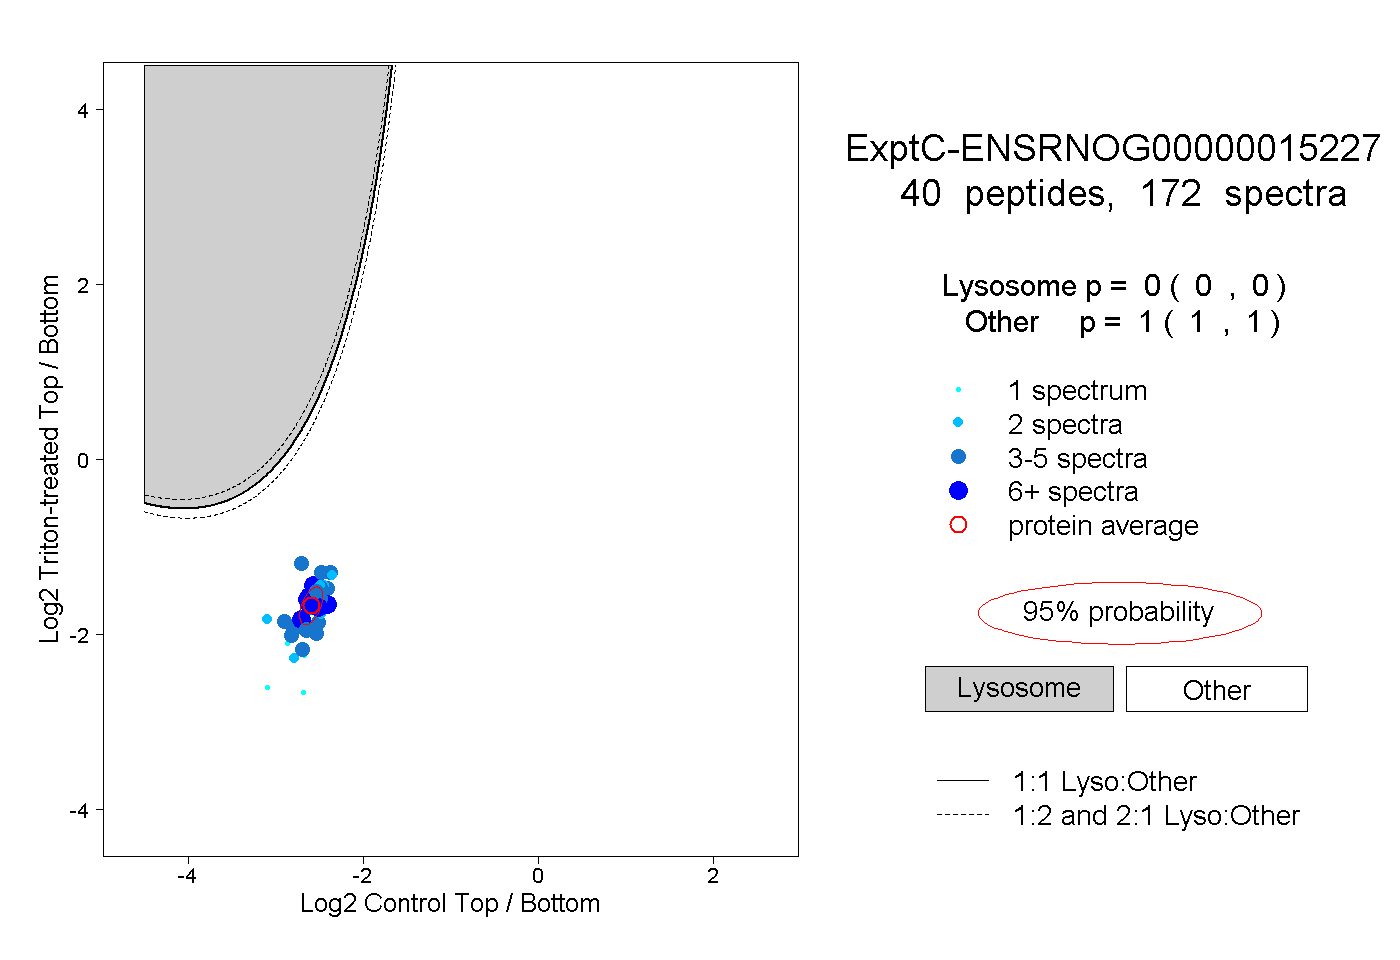
0.000 | 0.000
1.000 | 1.000
17peptides
spectra
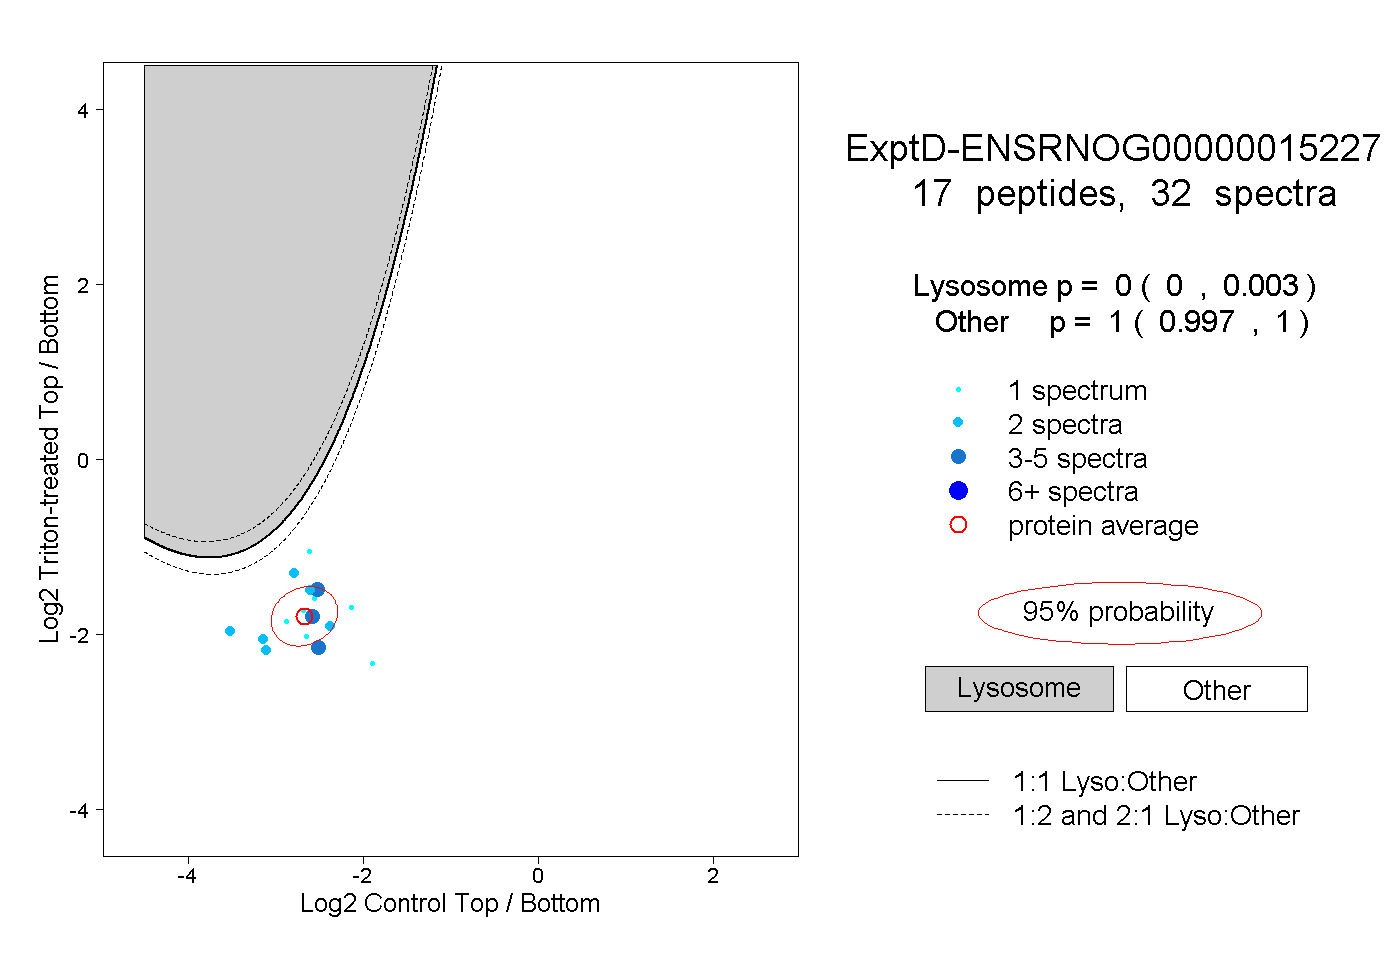
0.000 | 0.003
0.997 | 1.000