 7
7peptides
spectra
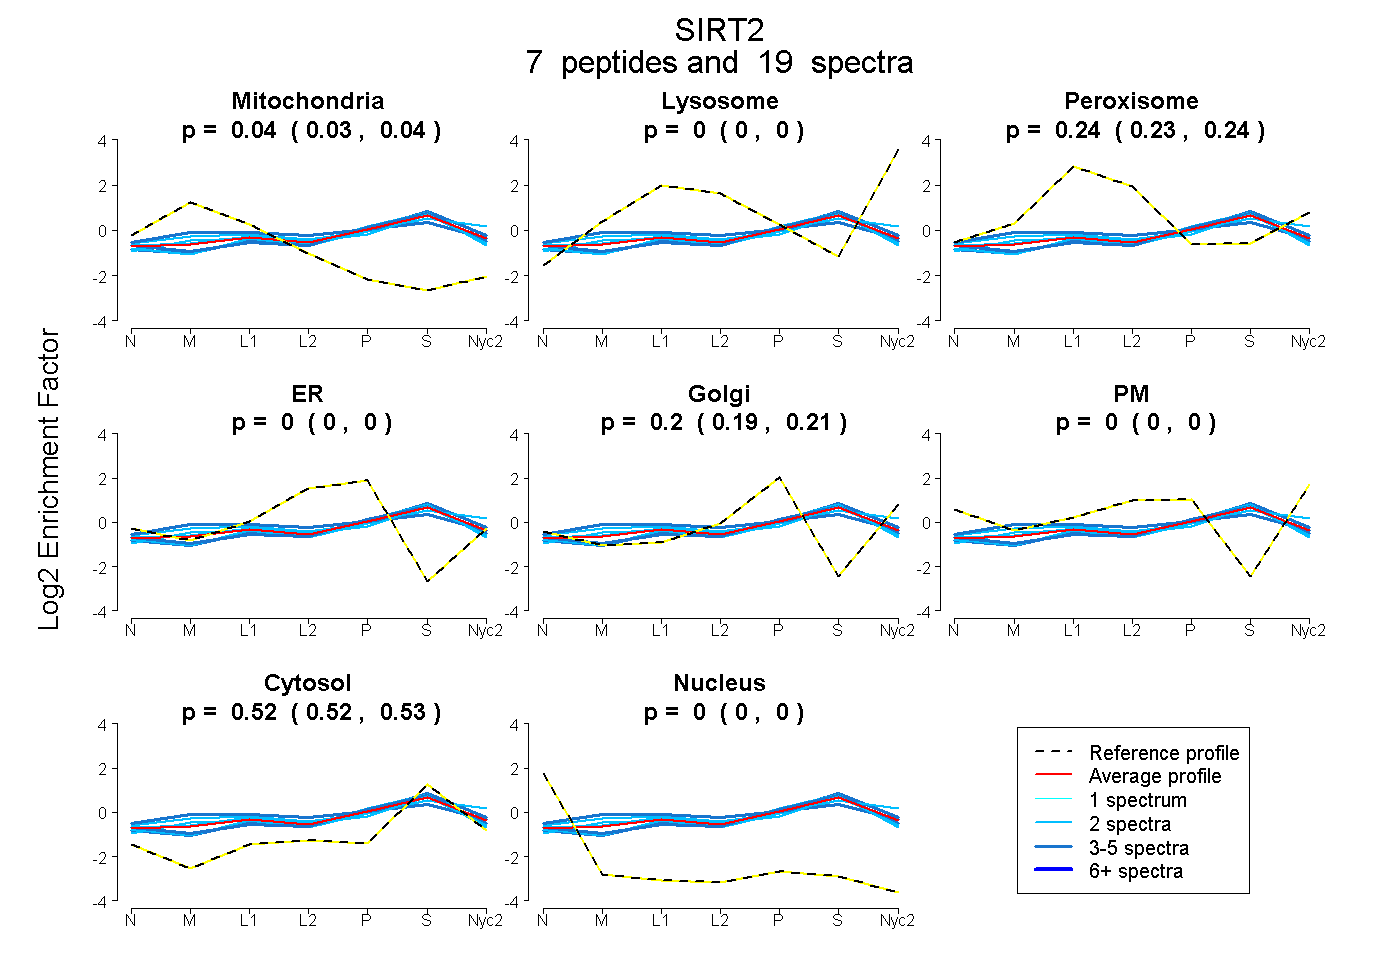
0.027 | 0.045
0.000 | 0.000
0.232 | 0.244
0.000 | 0.000
0.195 | 0.206
0.000 | 0.000
0.516 | 0.531
0.000 | 0.000
3peptides
spectra
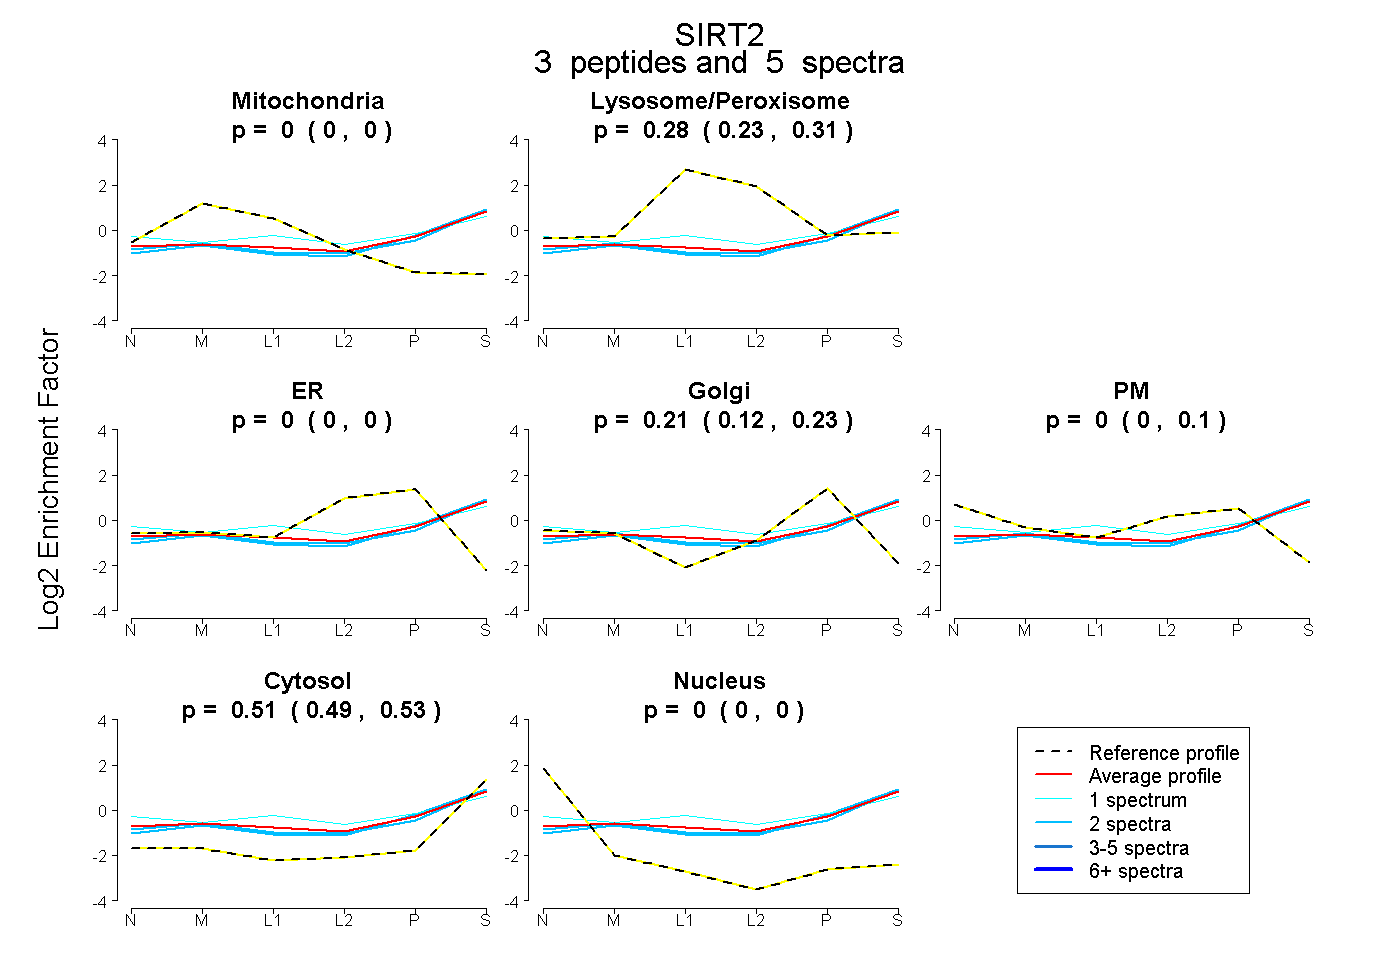
0.000 | 0.000
0.227 | 0.310
0.000 | 0.000
0.125 | 0.228
0.000 | 0.100
0.486 | 0.528
0.000 | 0.000
7peptides
spectra
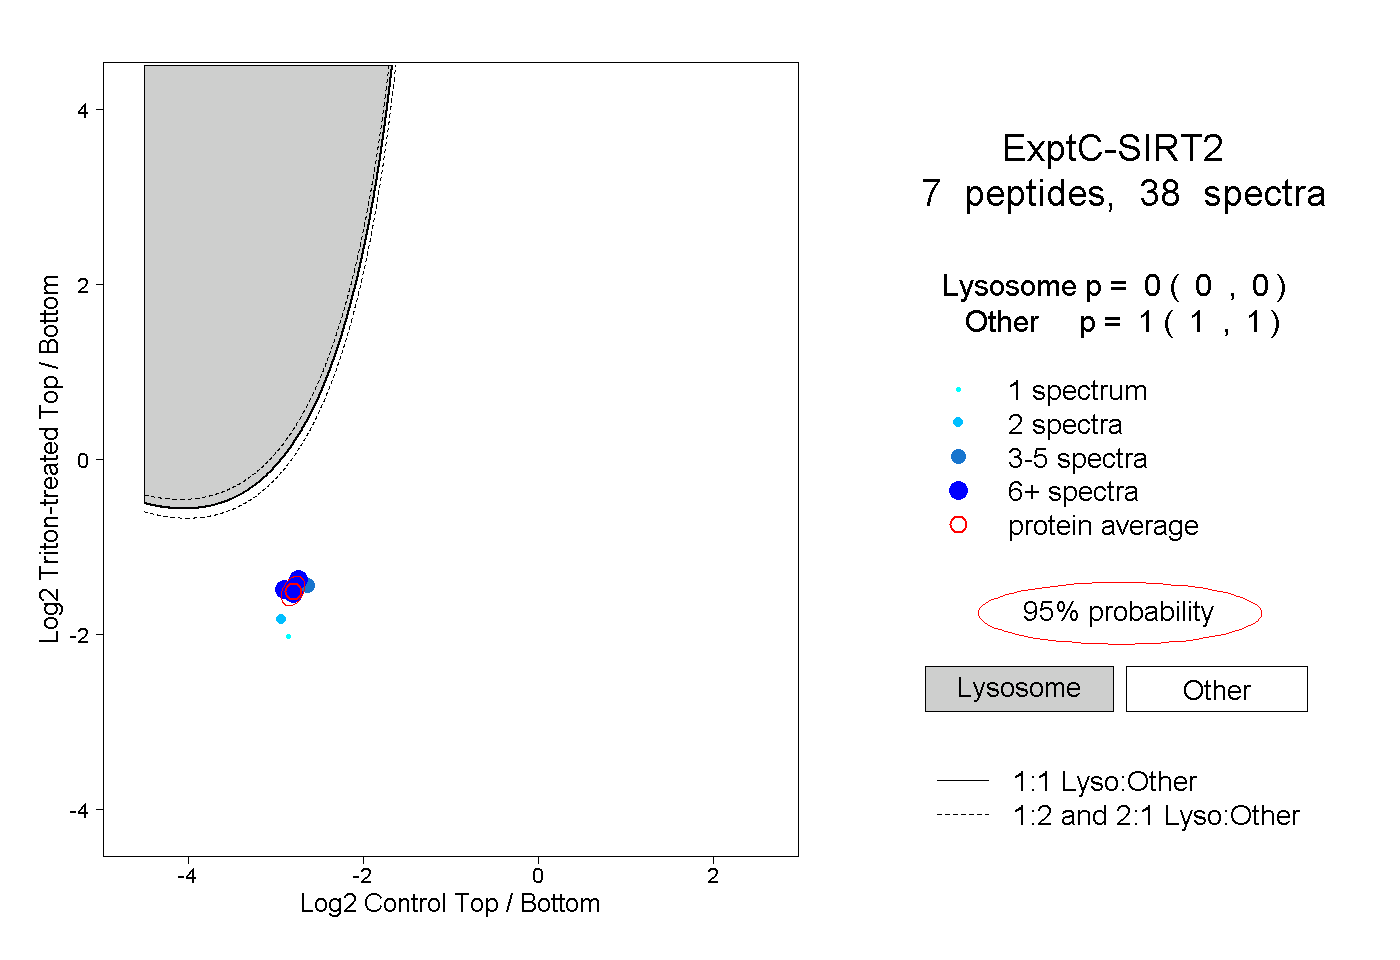
0.000 | 0.000
1.000 | 1.000
2peptides
spectra
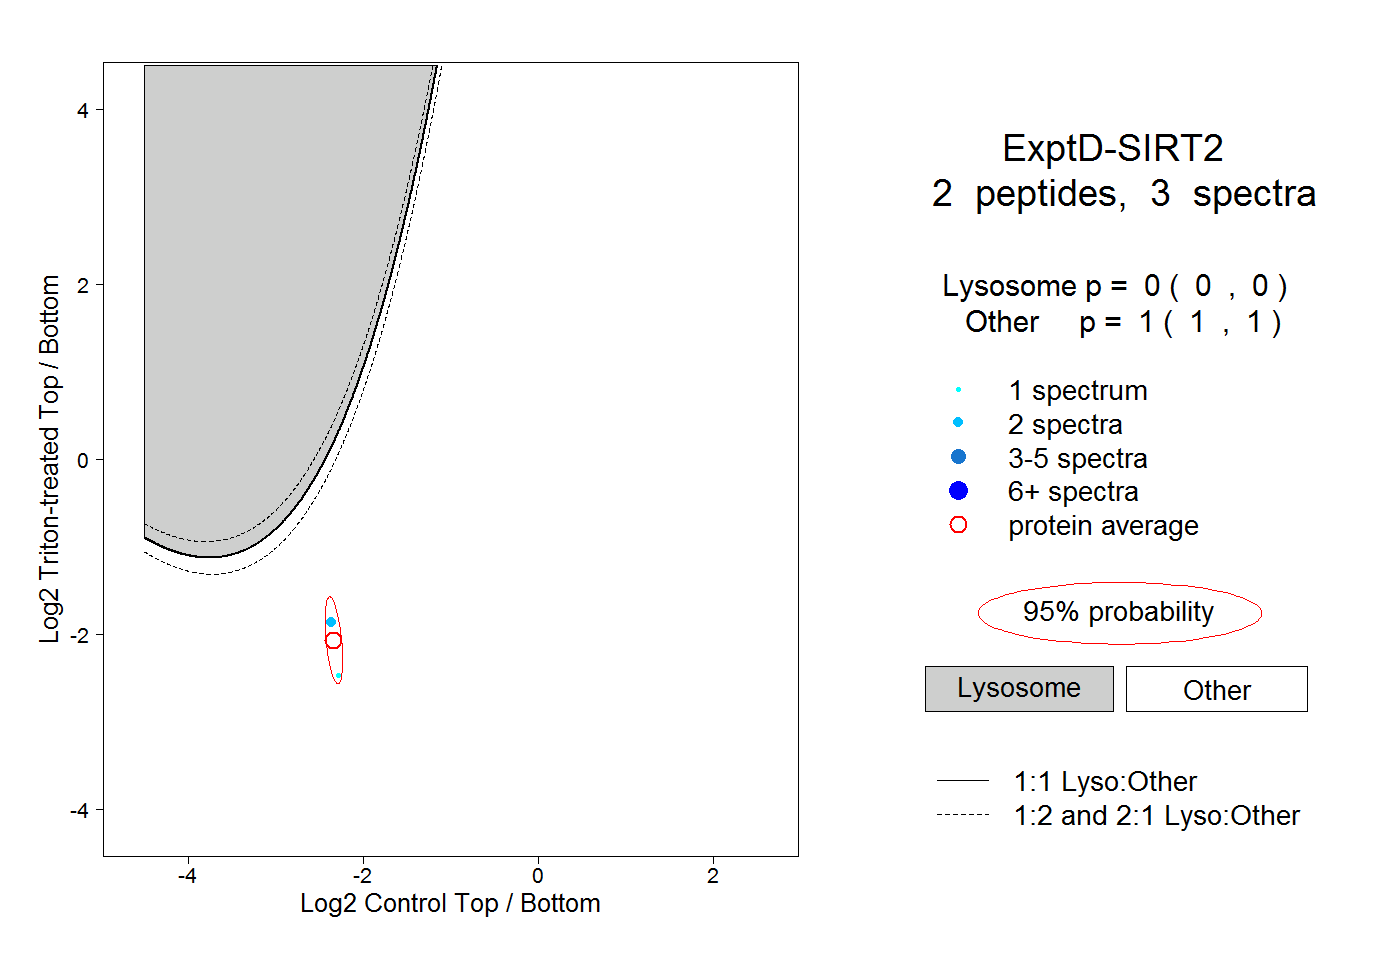
0.000 | 0.000
1.000 | 1.000