DMXL2
[ENSRNOP00000059323]
Main page
| | | Plot |
Mito |
Lyso |
|
Perox |
ER |
Golgi |
PM |
Cytosol |
Nucleus |
|
| Expt A |
 16
16
peptides |
29
spectra |
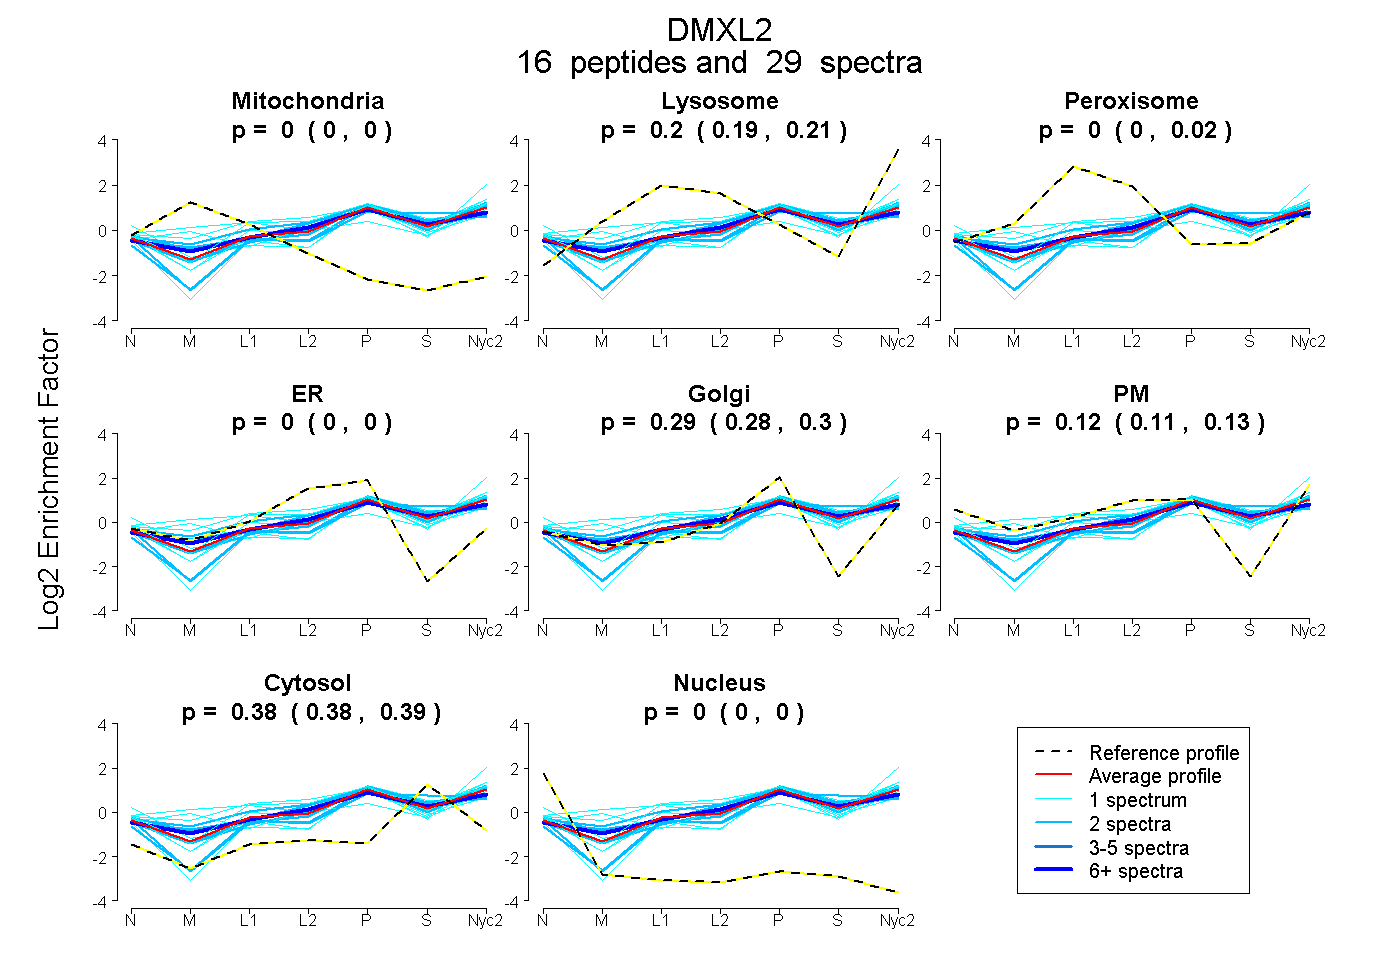 |
0.000
0.000 | 0.000 |
0.200
0.191 | 0.207 |
|
0.004
0.000 | 0.015 |
0.000
0.000 | 0.000 |
0.290
0.280 | 0.301 |
0.122
0.107 | 0.132 |
0.383
0.376 | 0.389 |
0.000
0.000 | 0.000 |
|
| | | Plot |
Mito |
|
Lyso or Perox |
|
ER |
Golgi |
PM |
Cytosol |
Nucleus |
|
| Expt B |
5
peptides |
8
spectra |
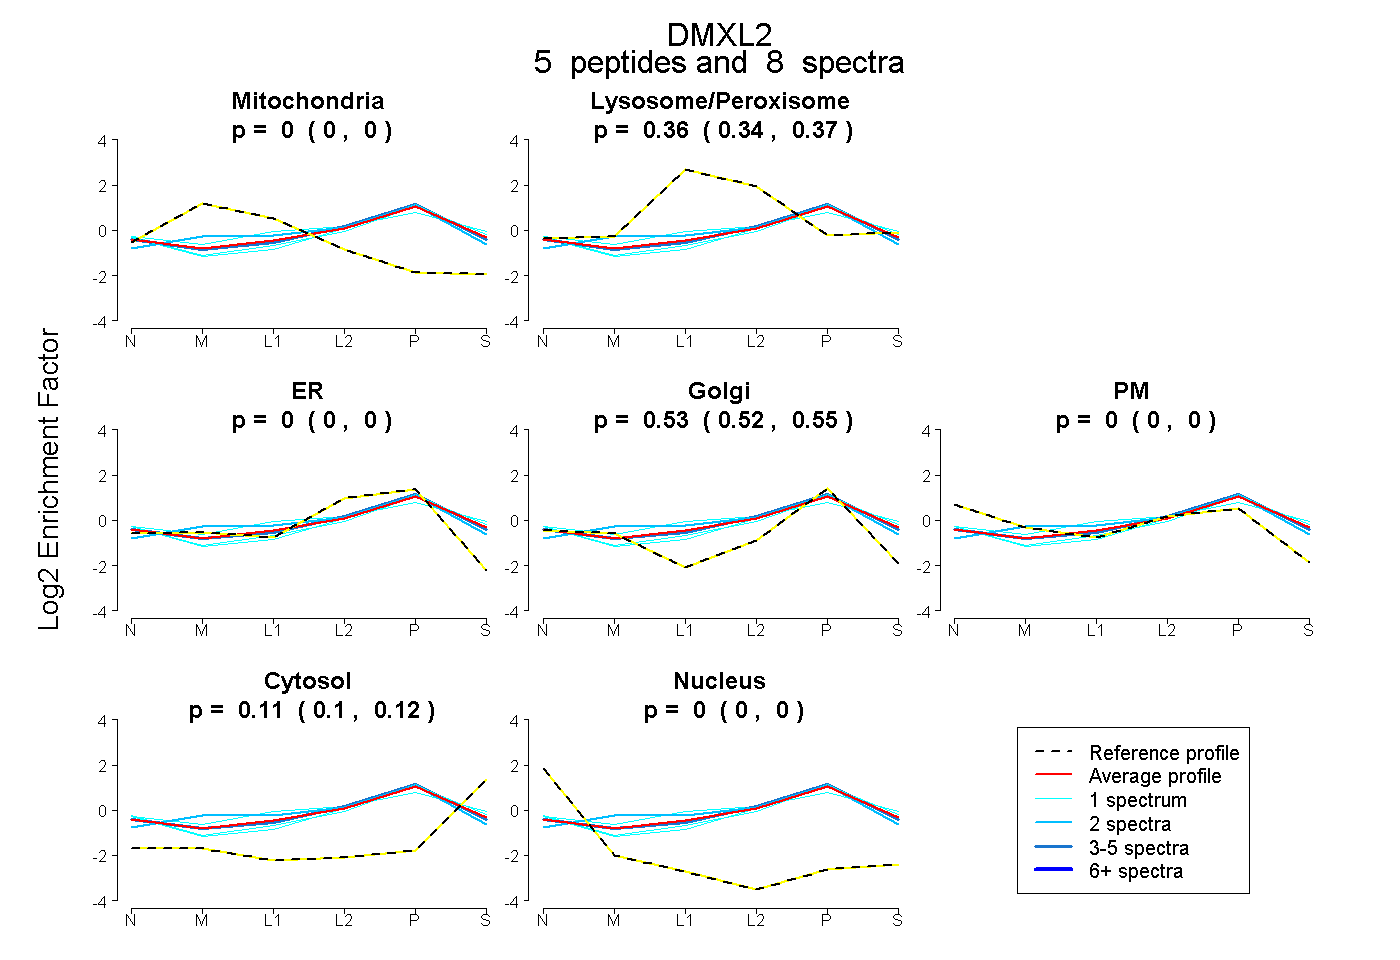 |
0.000
0.000 | 0.000 |
|
0.358
0.344 | 0.369 |
|
0.000
0.000 | 0.000 |
0.533
0.517 | 0.547 |
0.000
0.000 | 0.000 |
0.109
0.096 | 0.120 |
0.000
0.000 | 0.000 |
|
| 2 spectra, THPLLLR |
0.000 |
|
0.389 |
|
0.000 |
0.561 |
0.000 |
0.049 |
0.000 |
|
| 1 spectrum, LALHNIK |
0.000 |
|
0.437 |
|
0.000 |
0.423 |
0.000 |
0.140 |
0.000 |
|
| 1 spectrum, DTLDECGLR |
0.000 |
|
0.316 |
|
0.000 |
0.533 |
0.000 |
0.151 |
0.000 |
|
| 3 spectra, LLLSSR |
0.000 |
|
0.347 |
|
0.000 |
0.565 |
0.000 |
0.088 |
0.000 |
|
| 1 spectrum, LVVKPR |
0.000 |
|
0.295 |
|
0.010 |
0.567 |
0.000 |
0.128 |
0.000 |
|
| | | Plot |
|
Lyso |
|
|
|
|
|
|
|
Other |
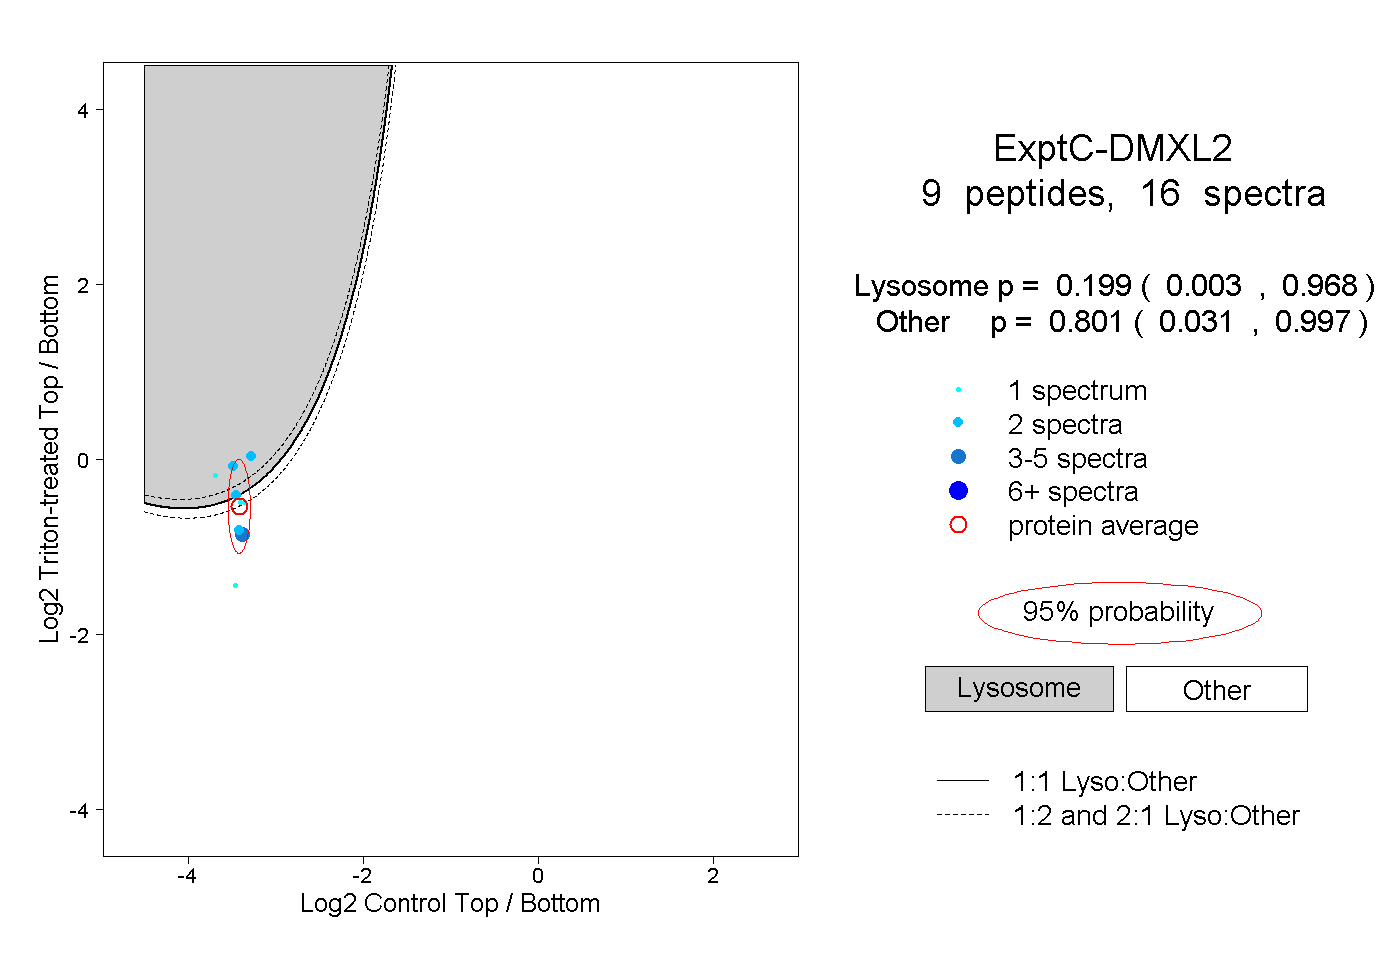
| Expt C |
9
peptides |
16
spectra |
 |
|
0.199
0.003 | 0.968 |
|
|
|
|
|
|
|
0.801
0.031 | 0.997 |
| | | Plot |
|
Lyso |
|
|
|
|
|
|
|
Other |
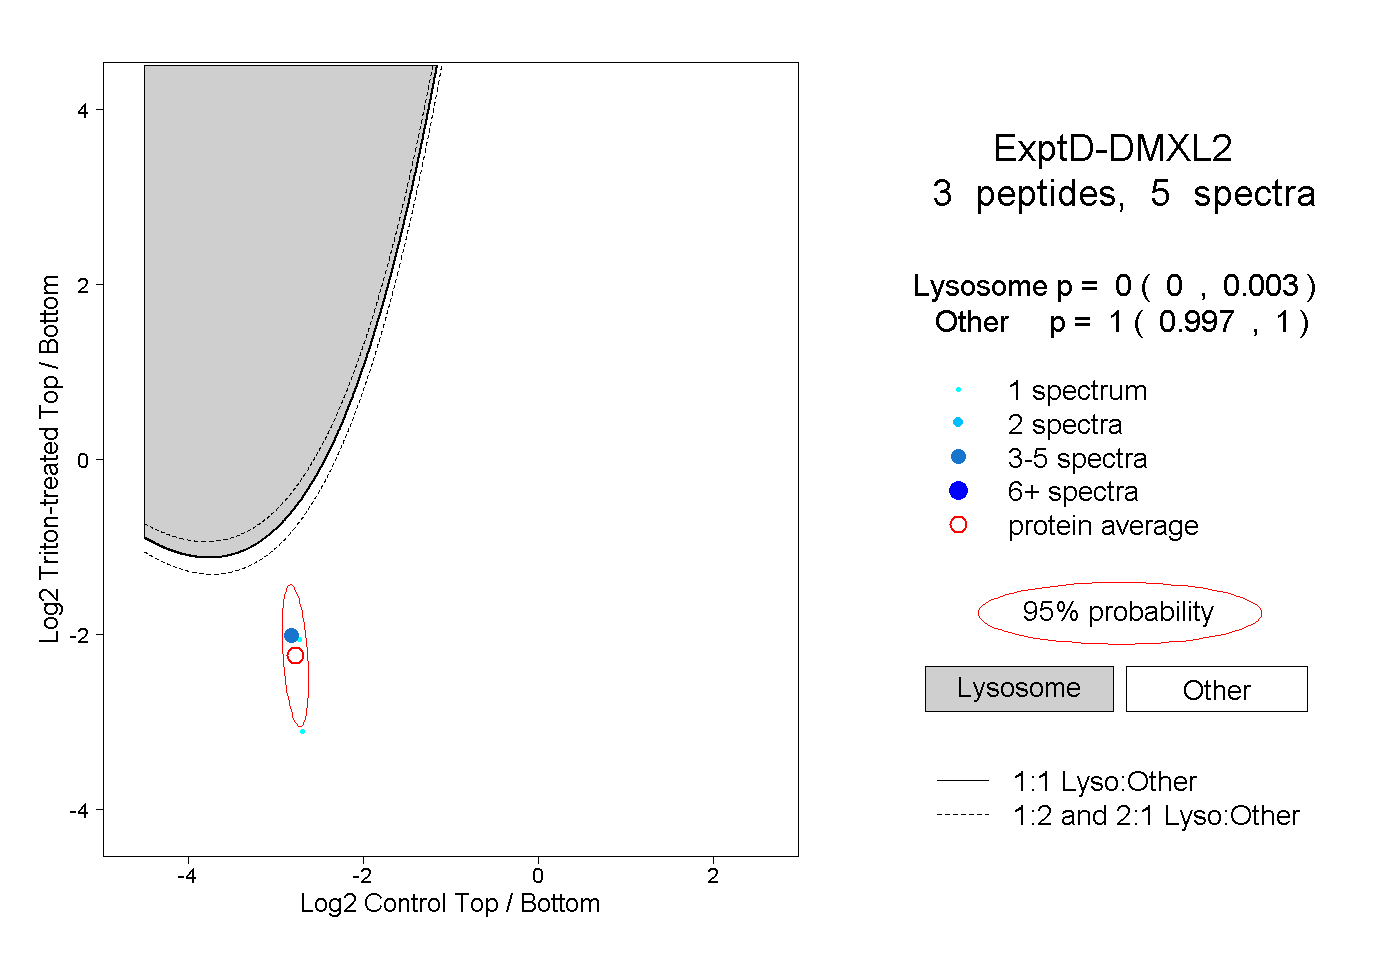
| Expt D |
3
peptides |
5
spectra |
 |
|
0.000
0.000 | 0.003 |
|
|
|
|
|
|
|
1.000
0.997 | 1.000 |