 5
5peptides
spectra
0.000 | 0.000
0.000 | 0.000
0.000 | 0.000
0.000 | 0.000
0.007 | 0.111
0.000 | 0.085
0.846 | 0.897
0.000 | 0.054
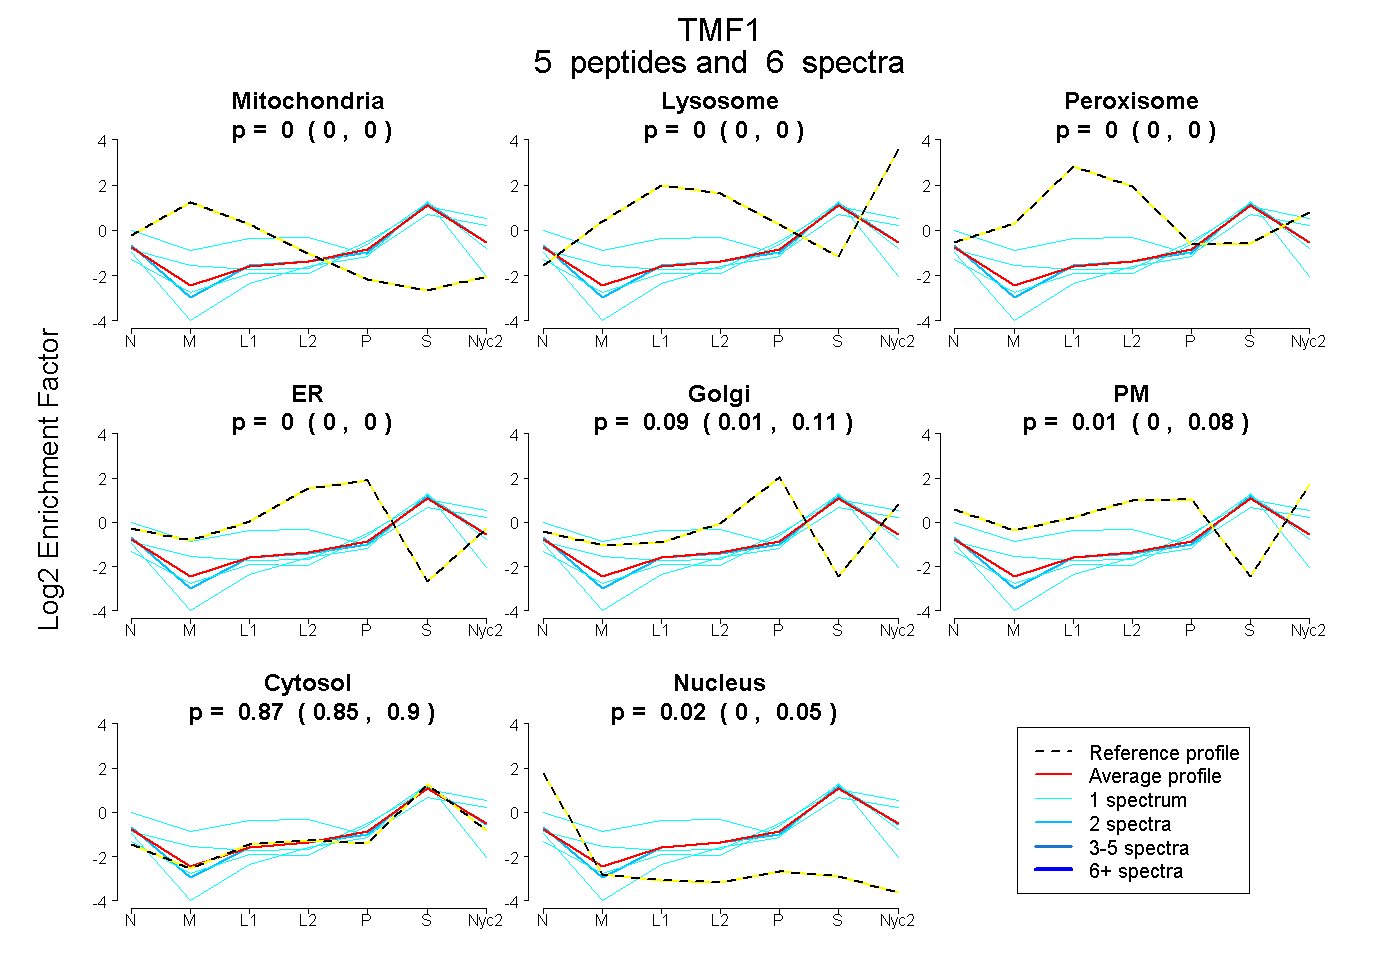
| Plot | Mito | Lyso | Perox | ER | Golgi | PM | Cytosol | Nucleus | |||||
| Expt A |
5 peptides |
6 spectra |
|
0.000 0.000 | 0.000 |
0.000 0.000 | 0.000 |
0.000 0.000 | 0.000 |
0.000 0.000 | 0.000 |
0.092 0.007 | 0.111 |
0.011 0.000 | 0.085 |
0.873 0.846 | 0.897 |
0.025 0.000 | 0.054 |