 16
16peptides
spectra
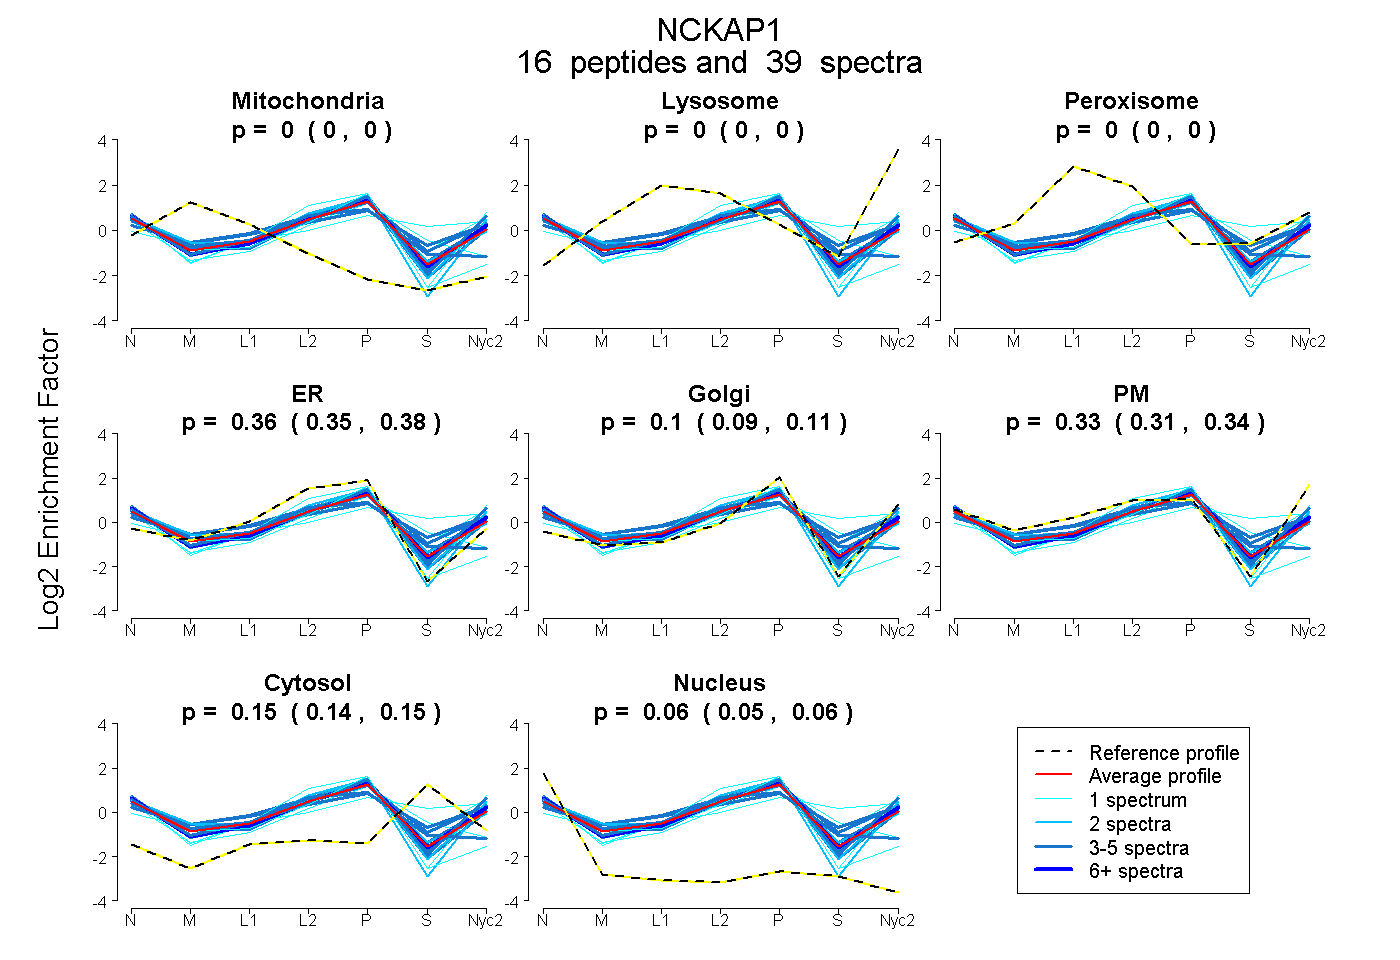
0.000 | 0.000
0.000 | 0.000
0.000 | 0.000
0.345 | 0.383
0.088 | 0.115
0.315 | 0.343
0.136 | 0.153
0.051 | 0.062
3peptides
spectra
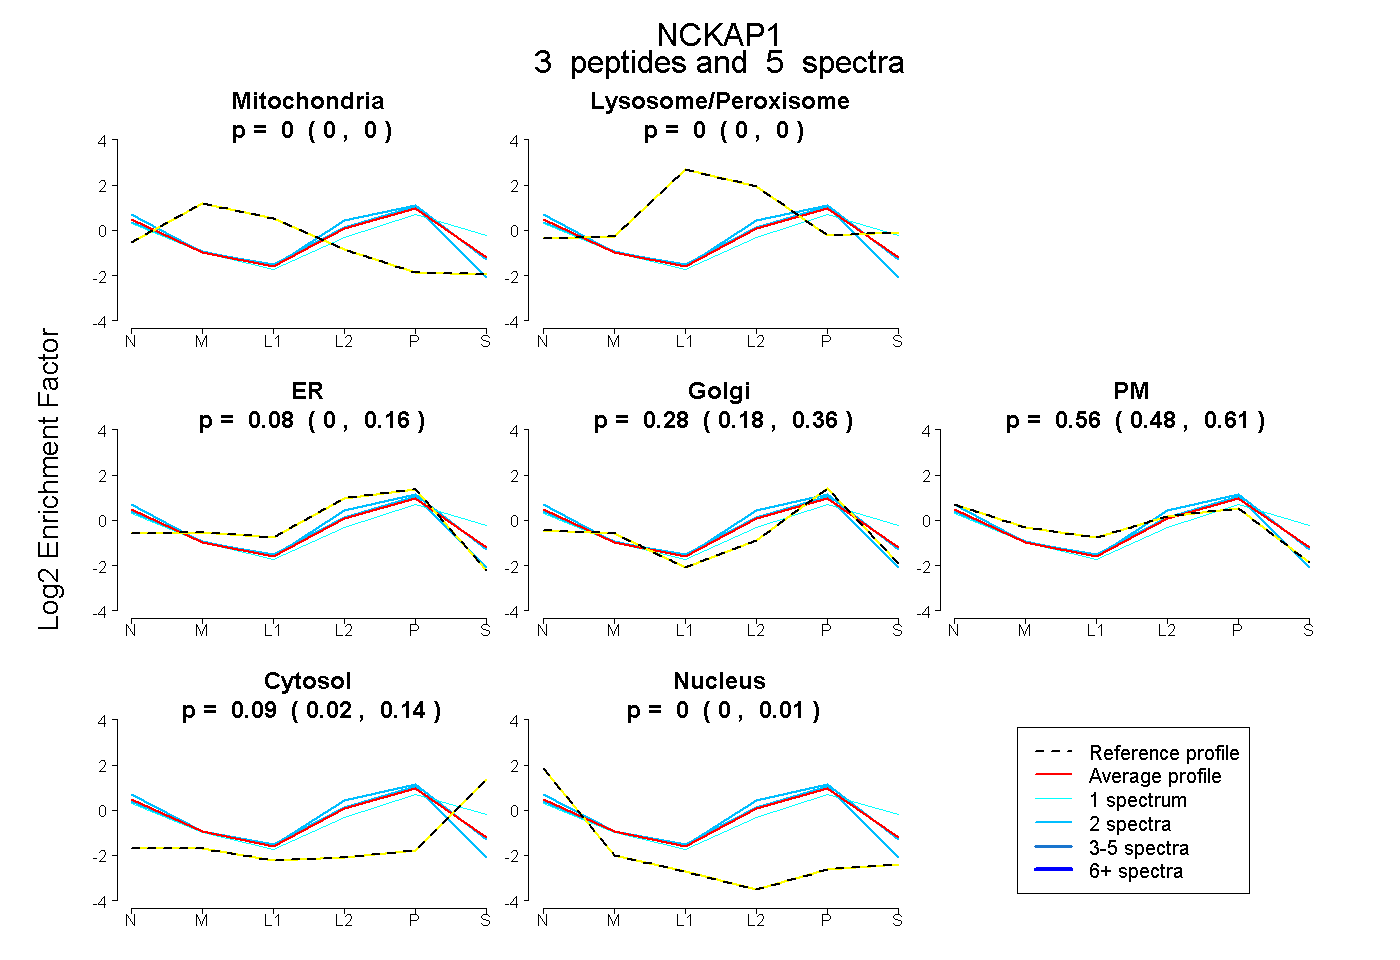
0.000 | 0.000
0.000 | 0.000
0.000 | 0.160
0.176 | 0.356
0.482 | 0.609
0.017 | 0.143
0.000 | 0.005
20peptides
spectra
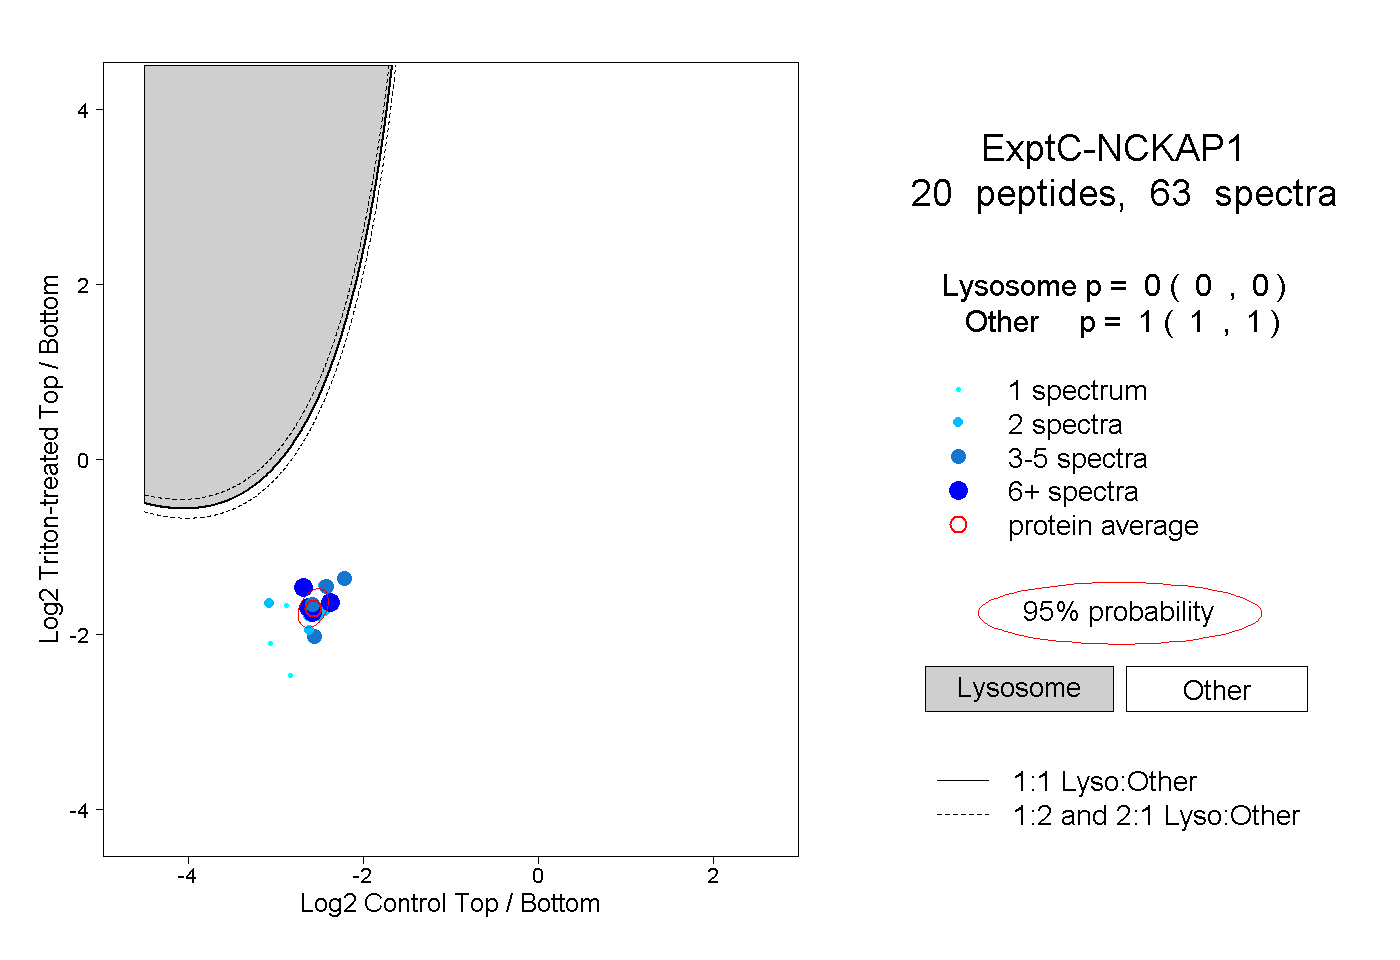
0.000 | 0.000
1.000 | 1.000
4peptides
spectra
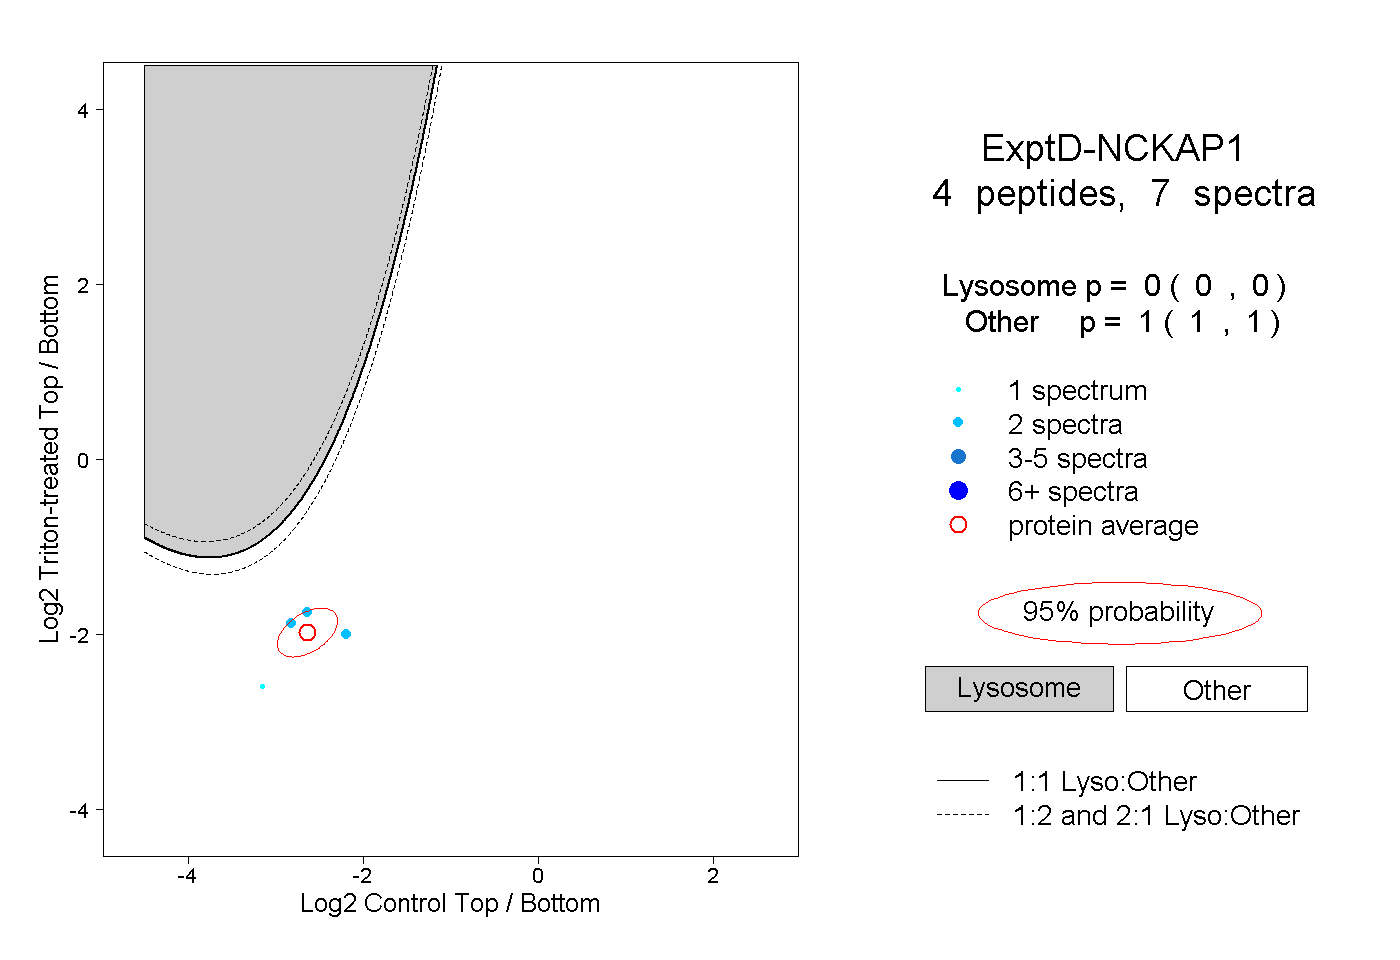
0.000 | 0.000
1.000 | 1.000