COBLL1
[ENSRNOP00000059197]
Main page
| | | Plot |
Mito |
Lyso |
|
Perox |
ER |
Golgi |
PM |
Cytosol |
Nucleus |
|
| Expt A |
 24
24
peptides |
57
spectra |
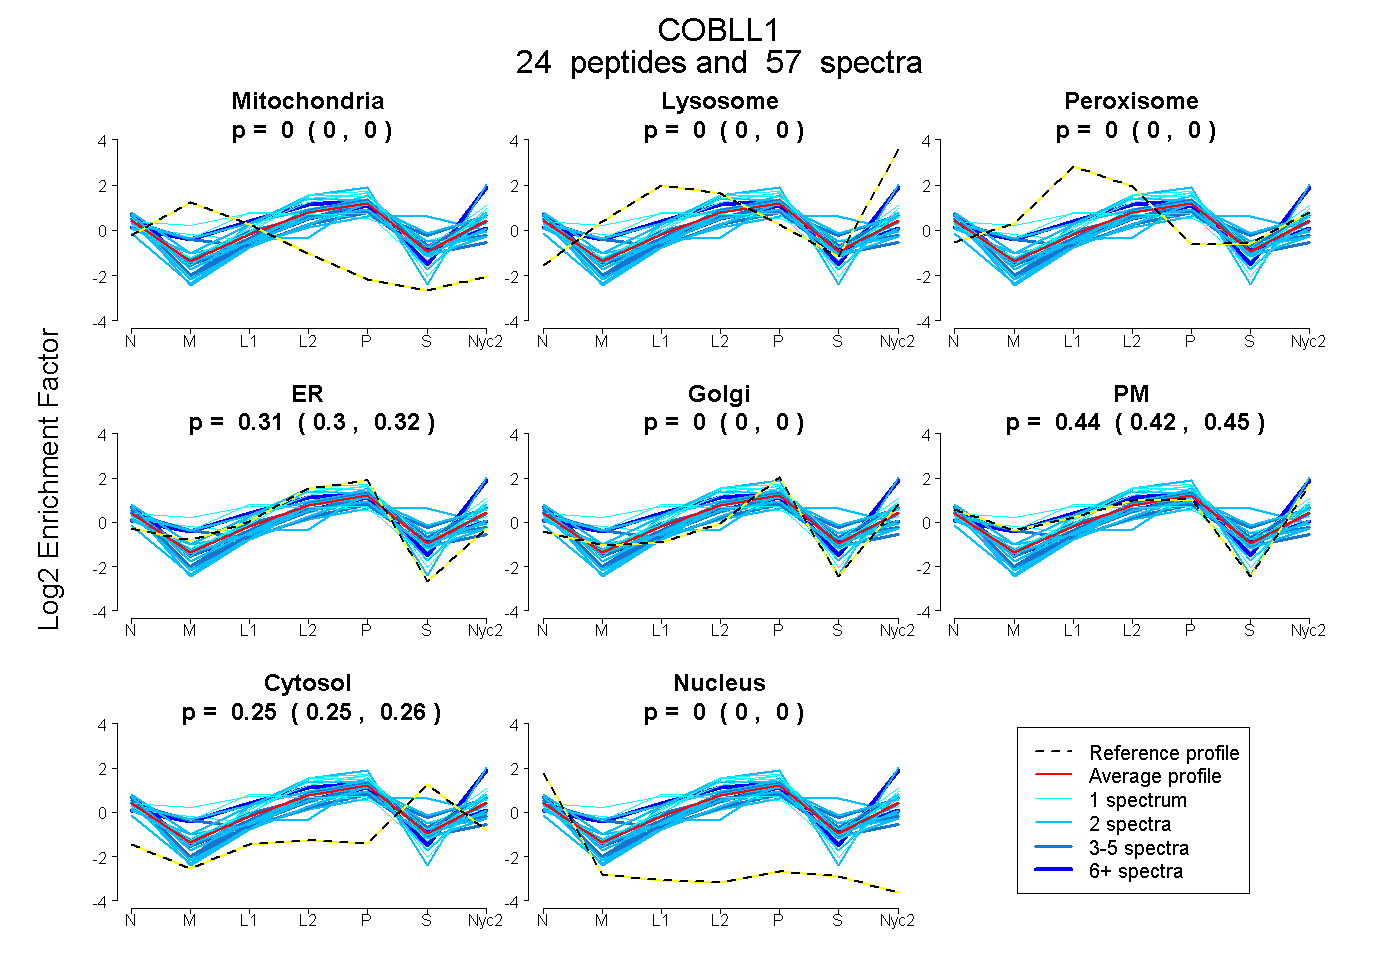 |
0.000
0.000 | 0.000 |
0.000
0.000 | 0.000 |
|
0.000
0.000 | 0.000 |
0.310
0.297 | 0.321 |
0.000
0.000 | 0.000 |
0.437
0.423 | 0.448 |
0.253
0.248 | 0.257 |
0.000
0.000 | 0.000 |
|
| | | Plot |
Mito |
|
Lyso or Perox |
|
ER |
Golgi |
PM |
Cytosol |
Nucleus |
|
| Expt B |
8
peptides |
16
spectra |
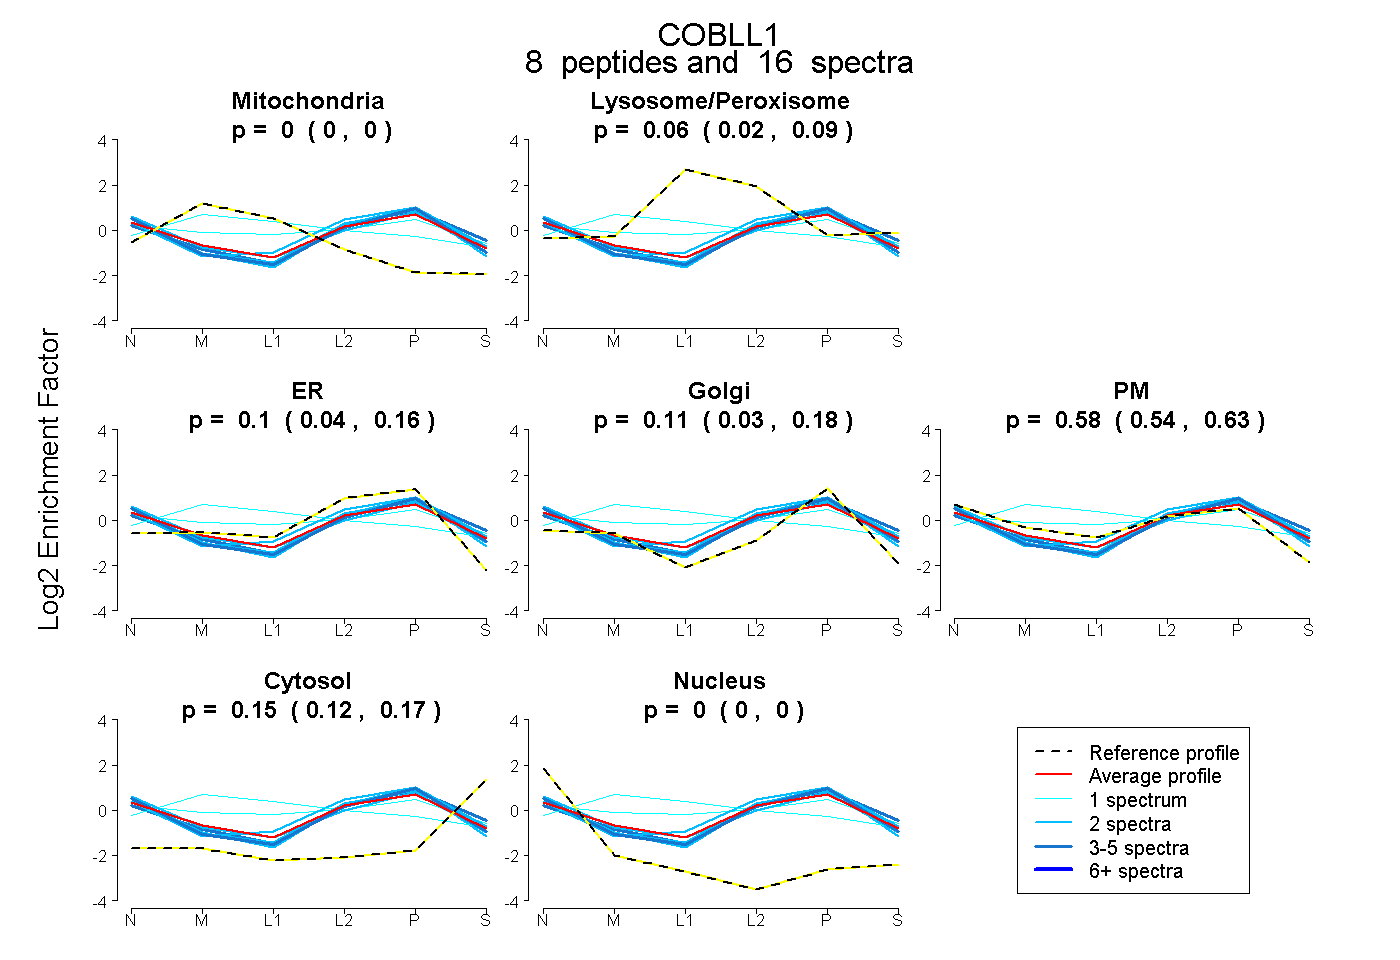 |
0.000
0.000 | 0.000 |
|
0.055
0.019 | 0.088 |
|
0.100
0.038 | 0.156 |
0.114
0.034 | 0.181 |
0.585
0.537 | 0.626 |
0.146
0.121 | 0.167 |
0.000
0.000 | 0.000 |
|
| 1 spectrum, SGEAAAK |
0.360 |
|
0.320 |
|
0.000 |
0.197 |
0.080 |
0.043 |
0.000 |
|
| 1 spectrum, DYQAQEPLDLTK |
0.000 |
|
0.270 |
|
0.000 |
0.145 |
0.468 |
0.117 |
0.000 |
|
| 2 spectra, SLNDLGLR |
0.000 |
|
0.022 |
|
0.000 |
0.145 |
0.725 |
0.108 |
0.000 |
|
| 2 spectra, NFPLYR |
0.000 |
|
0.096 |
|
0.255 |
0.085 |
0.435 |
0.130 |
0.000 |
|
| 2 spectra, LSGSPAGR |
0.000 |
|
0.000 |
|
0.114 |
0.245 |
0.556 |
0.085 |
0.000 |
|
| 3 spectra, ELYAMDISR |
0.000 |
|
0.031 |
|
0.241 |
0.101 |
0.420 |
0.206 |
0.000 |
|
| 2 spectra, QSLLTAIR |
0.000 |
|
0.000 |
|
0.181 |
0.057 |
0.600 |
0.162 |
0.000 |
|
| 3 spectra, VGDVEAER |
0.000 |
|
0.000 |
|
0.103 |
0.192 |
0.585 |
0.121 |
0.000 |
|
| | | Plot |
|
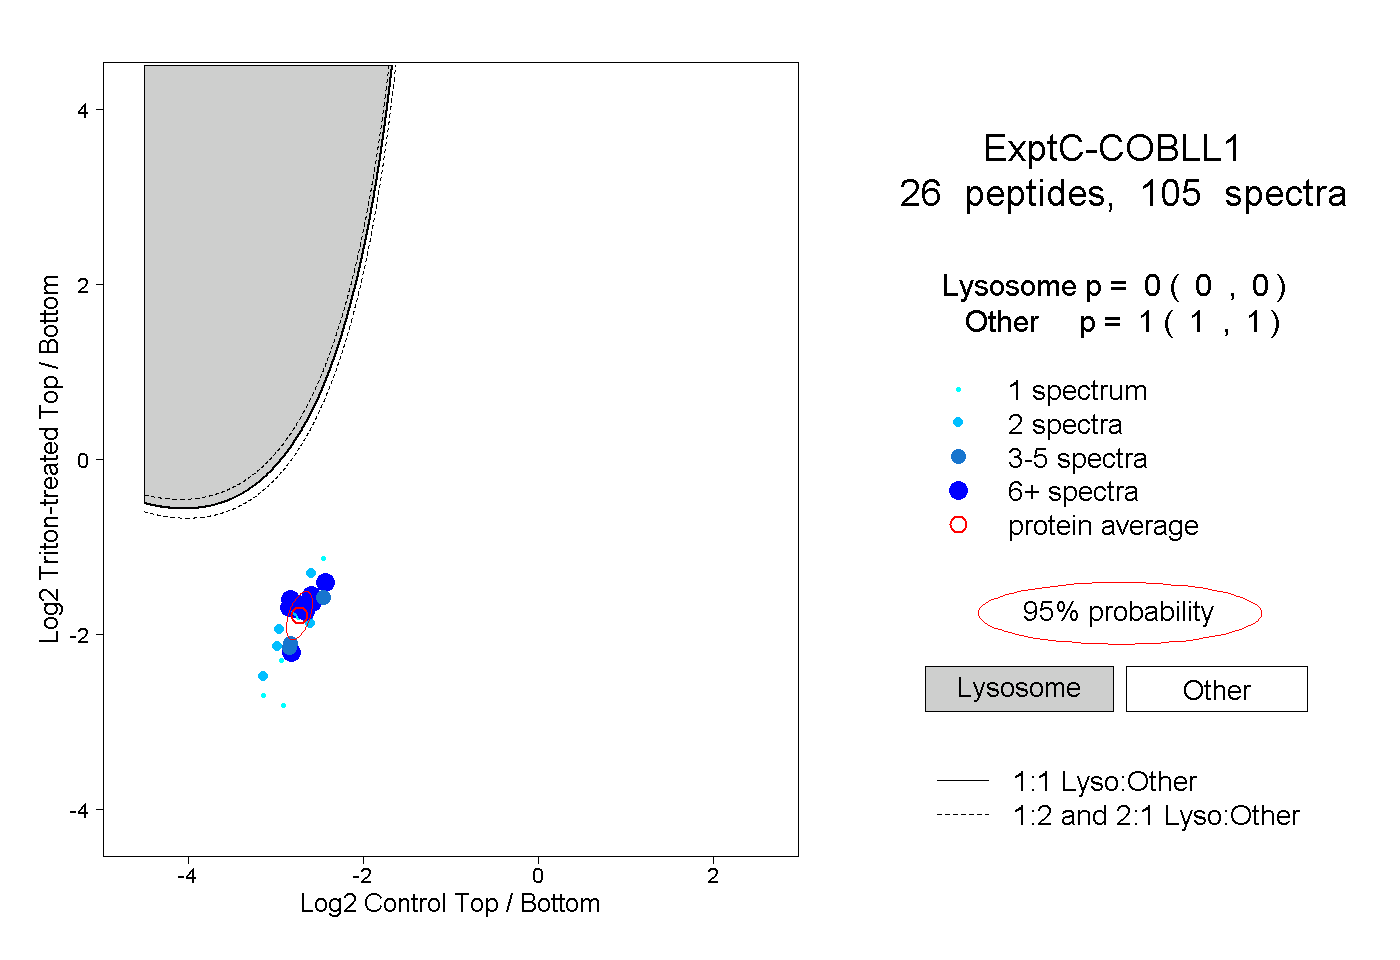
Lyso |
|
|
|
|
|
|
|
Other |
| Expt C |
26
peptides |
105
spectra |
 |
|
0.000
0.000 | 0.000 |
|
|
|
|
|
|
|
1.000
1.000 | 1.000 |
| | | Plot |
|
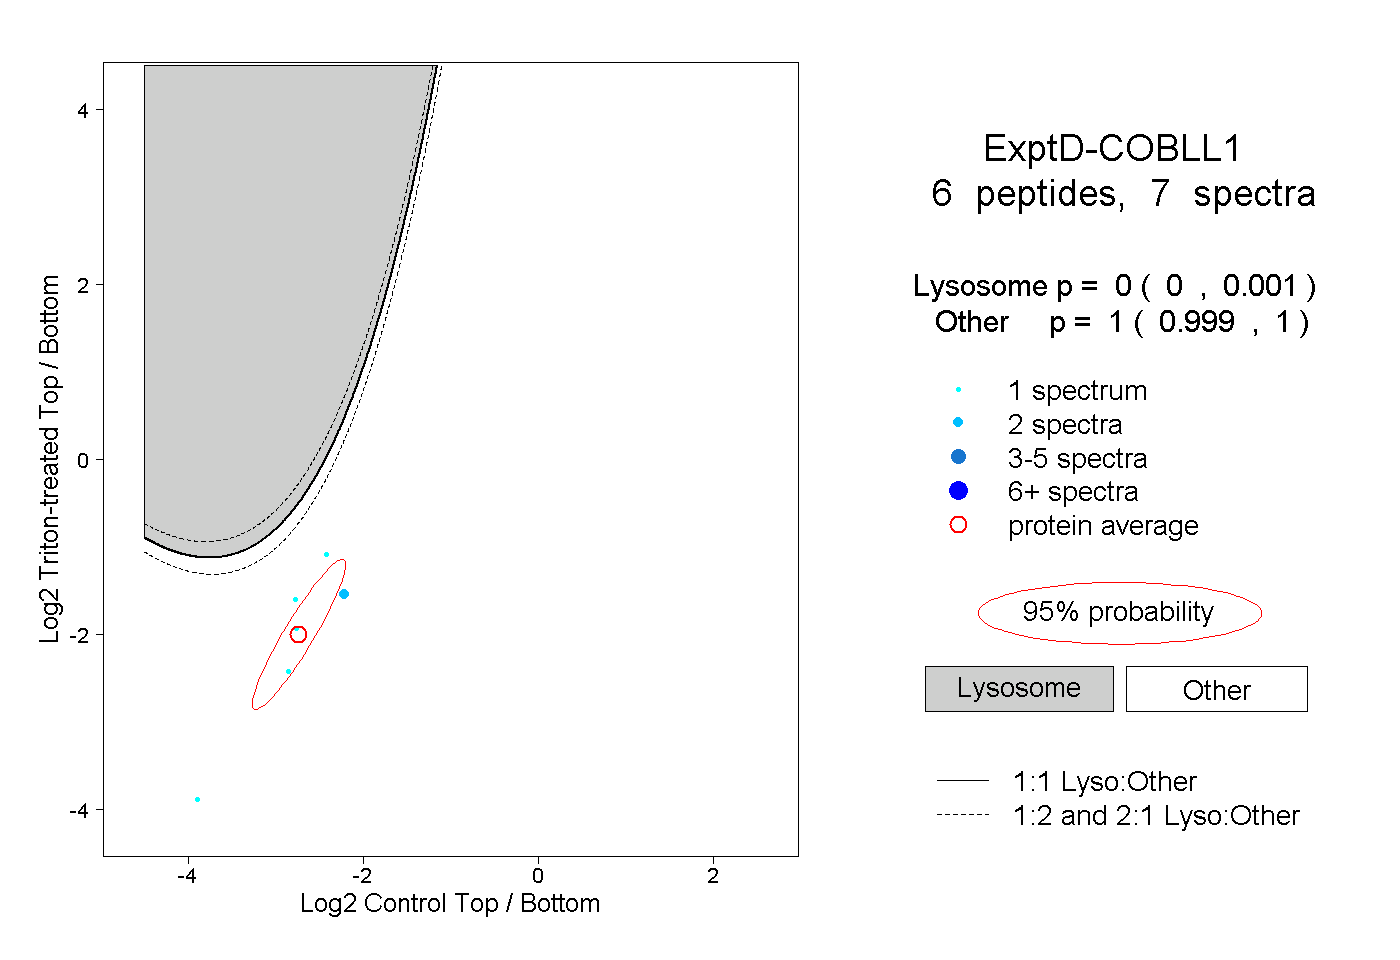
Lyso |
|
|
|
|
|
|
|
Other |
| Expt D |
6
peptides |
7
spectra |
 |
|
0.000
0.000 | 0.001 |
|
|
|
|
|
|
|
1.000
0.999 | 1.000 |