 5
5peptides
spectra
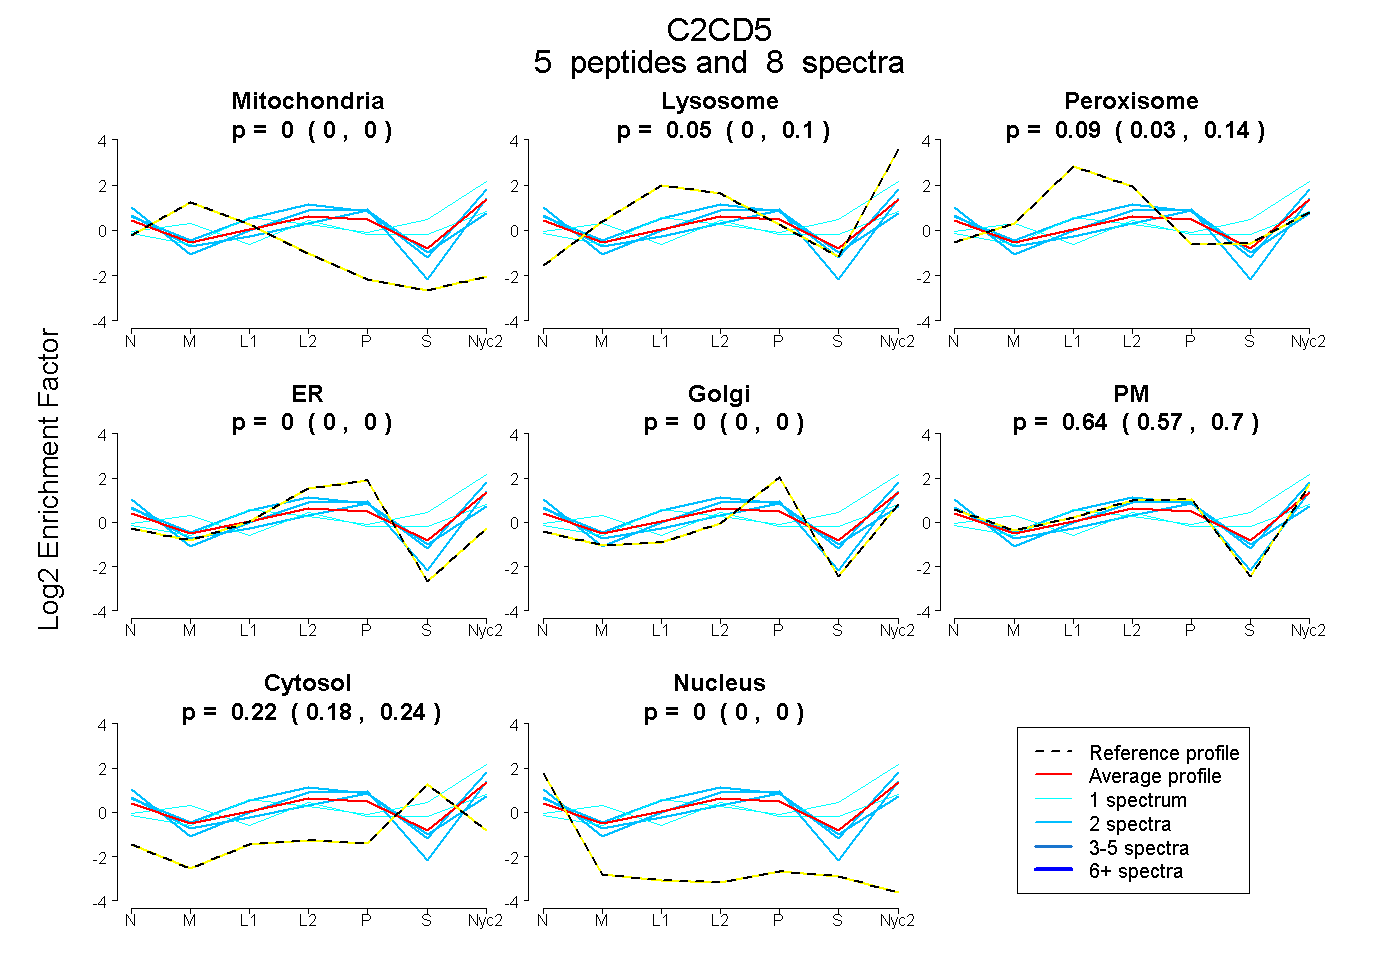
0.000 | 0.000
0.000 | 0.103
0.031 | 0.138
0.000 | 0.000
0.000 | 0.000
0.567 | 0.700
0.183 | 0.244
0.000 | 0.000
1peptide
spectra
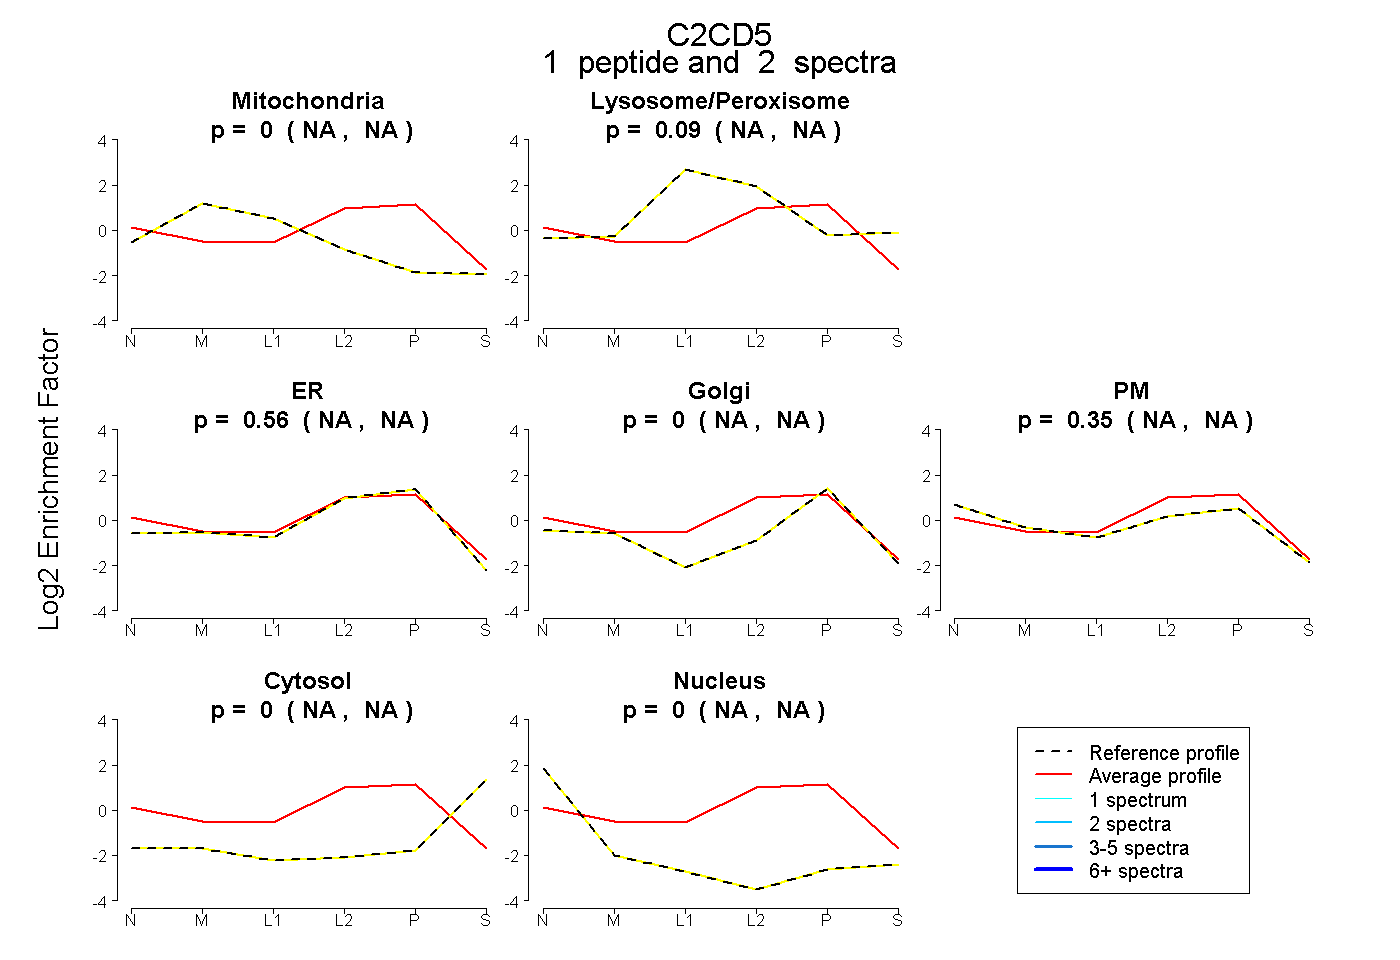
NA | NA
NA | NA
NA | NA
NA | NA
NA | NA
NA | NA
NA | NA
1peptide
spectra
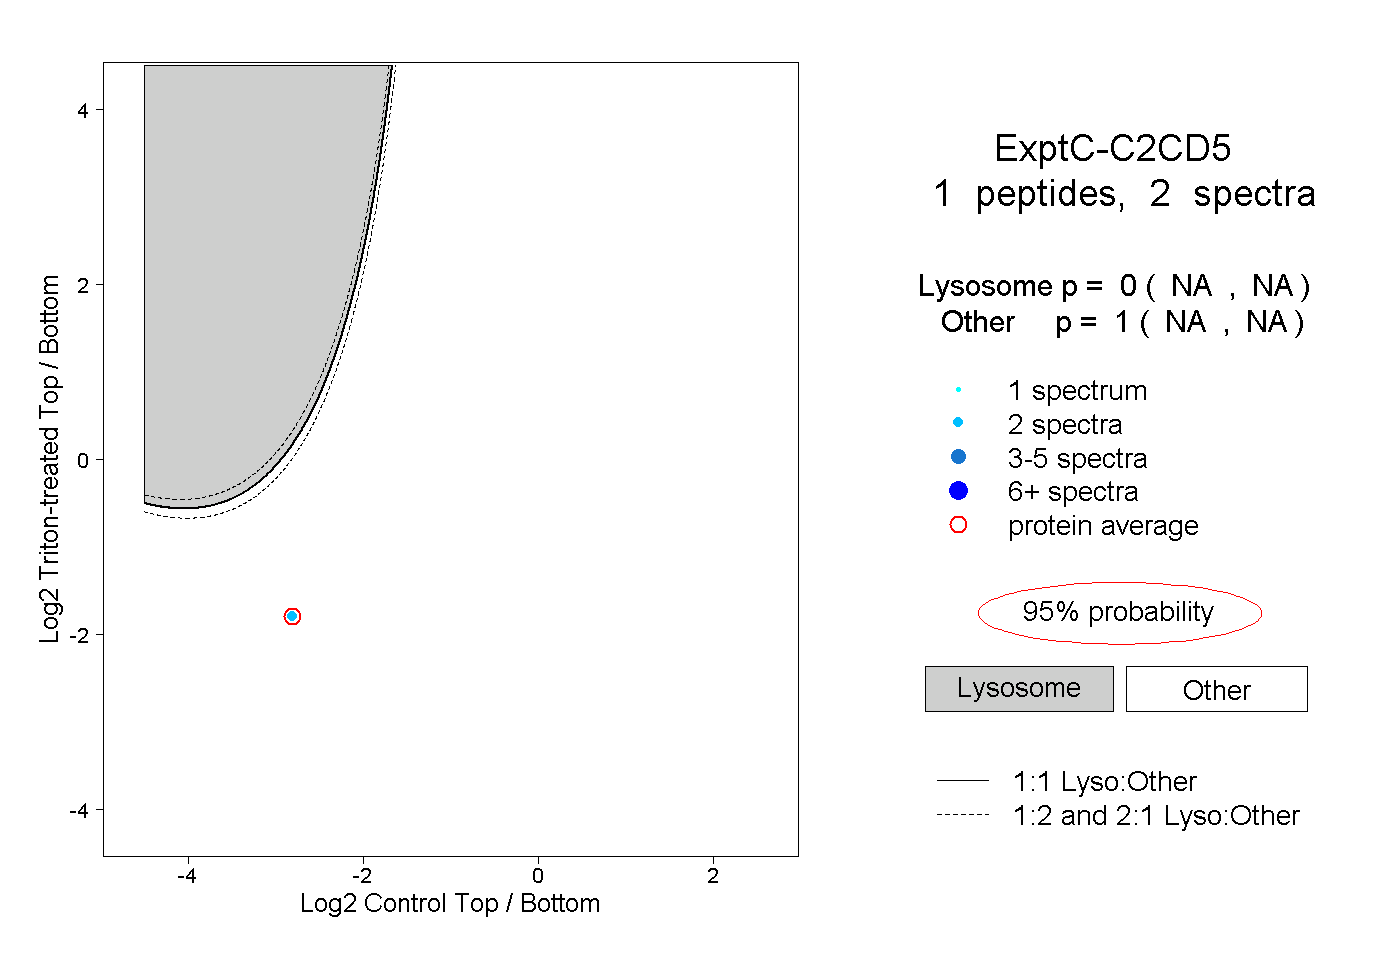
NA | NA
NA | NA