16
16peptides
spectra
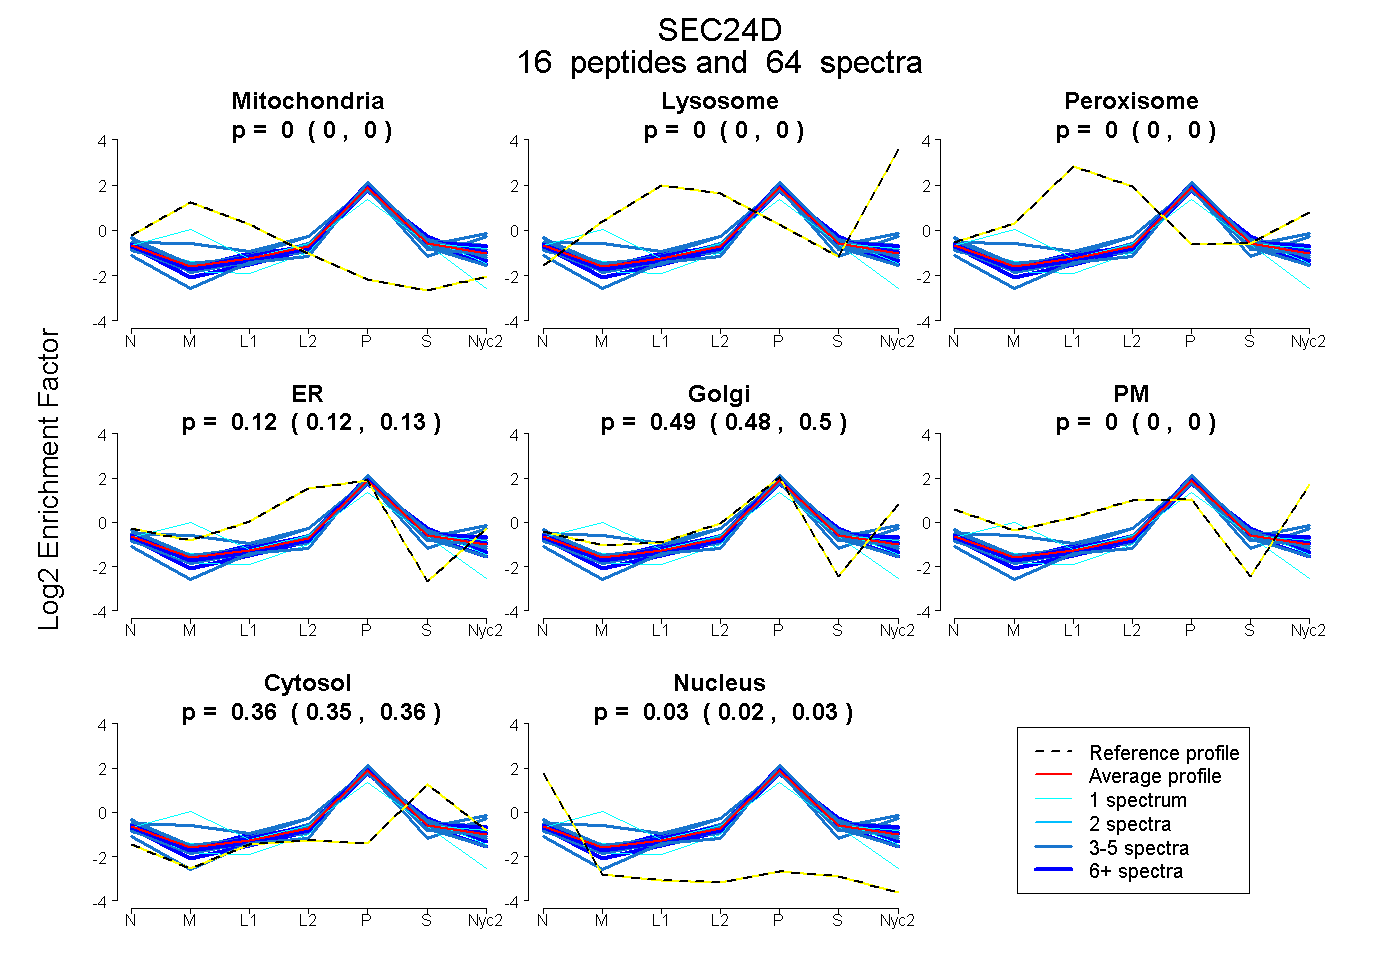
0.000 | 0.000
0.000 | 0.000
0.000 | 0.000
0.115 | 0.131
0.482 | 0.501
0.000 | 0.000
0.355 | 0.360
0.024 | 0.029
9peptides
spectra
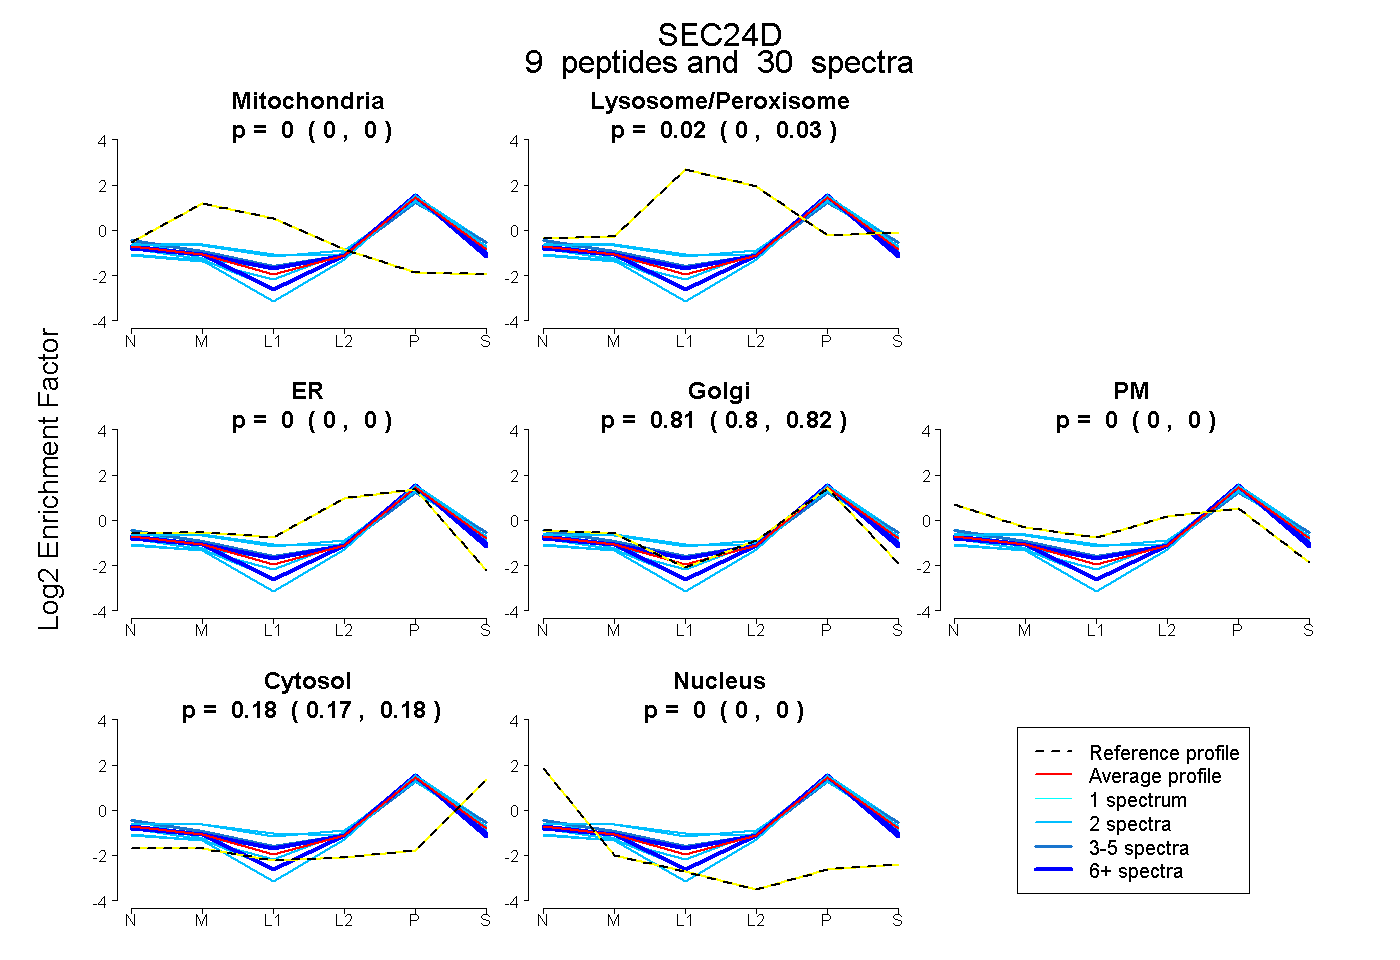
0.000 | 0.000
0.005 | 0.026
0.000 | 0.000
0.798 | 0.815
0.000 | 0.000
0.171 | 0.181
0.000 | 0.000
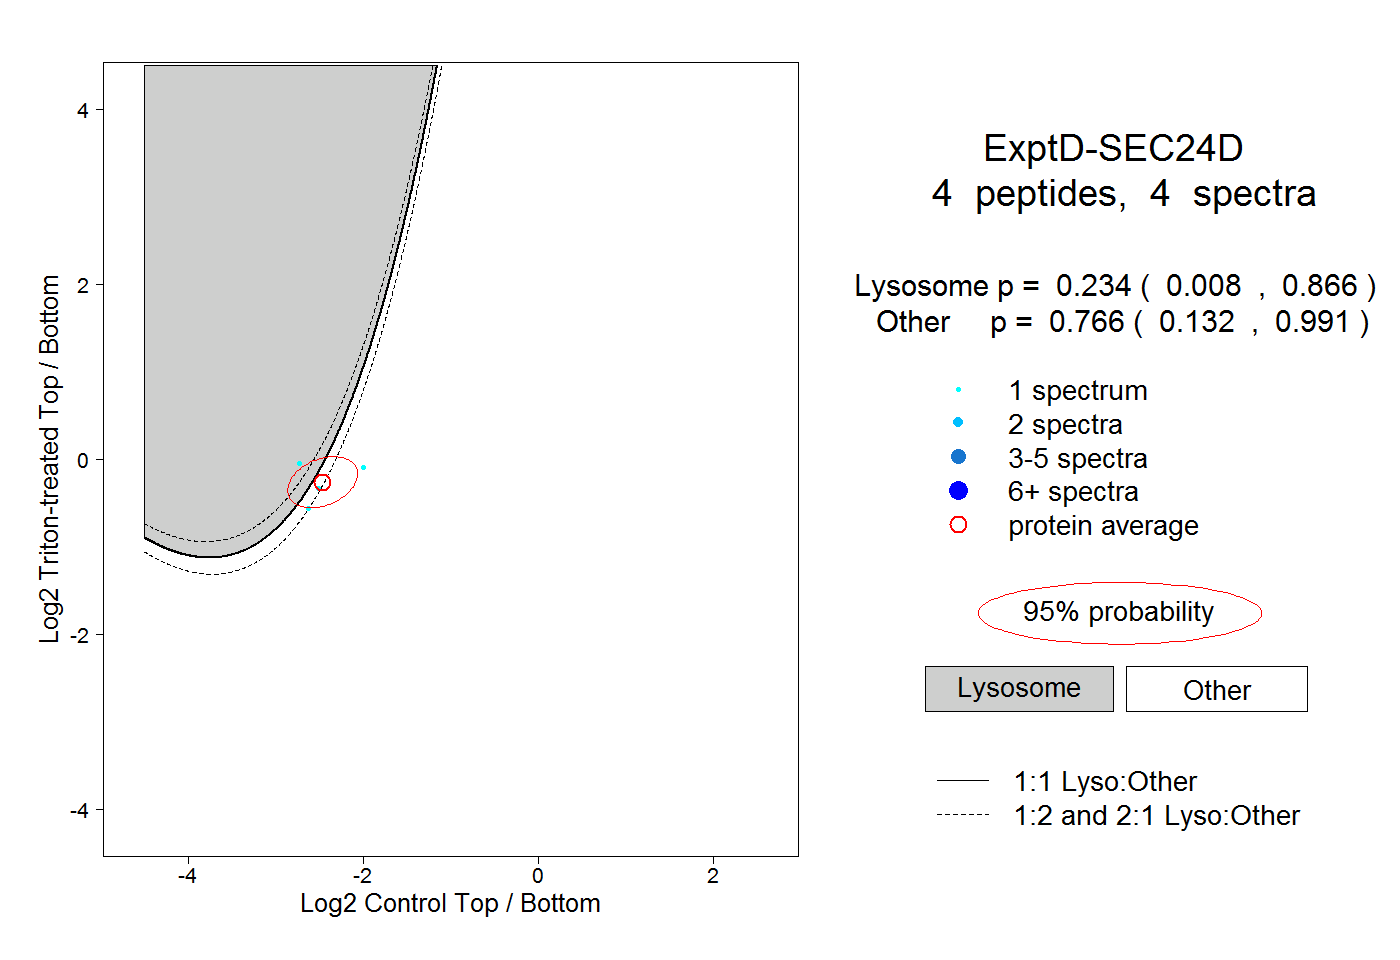
19peptides
spectra
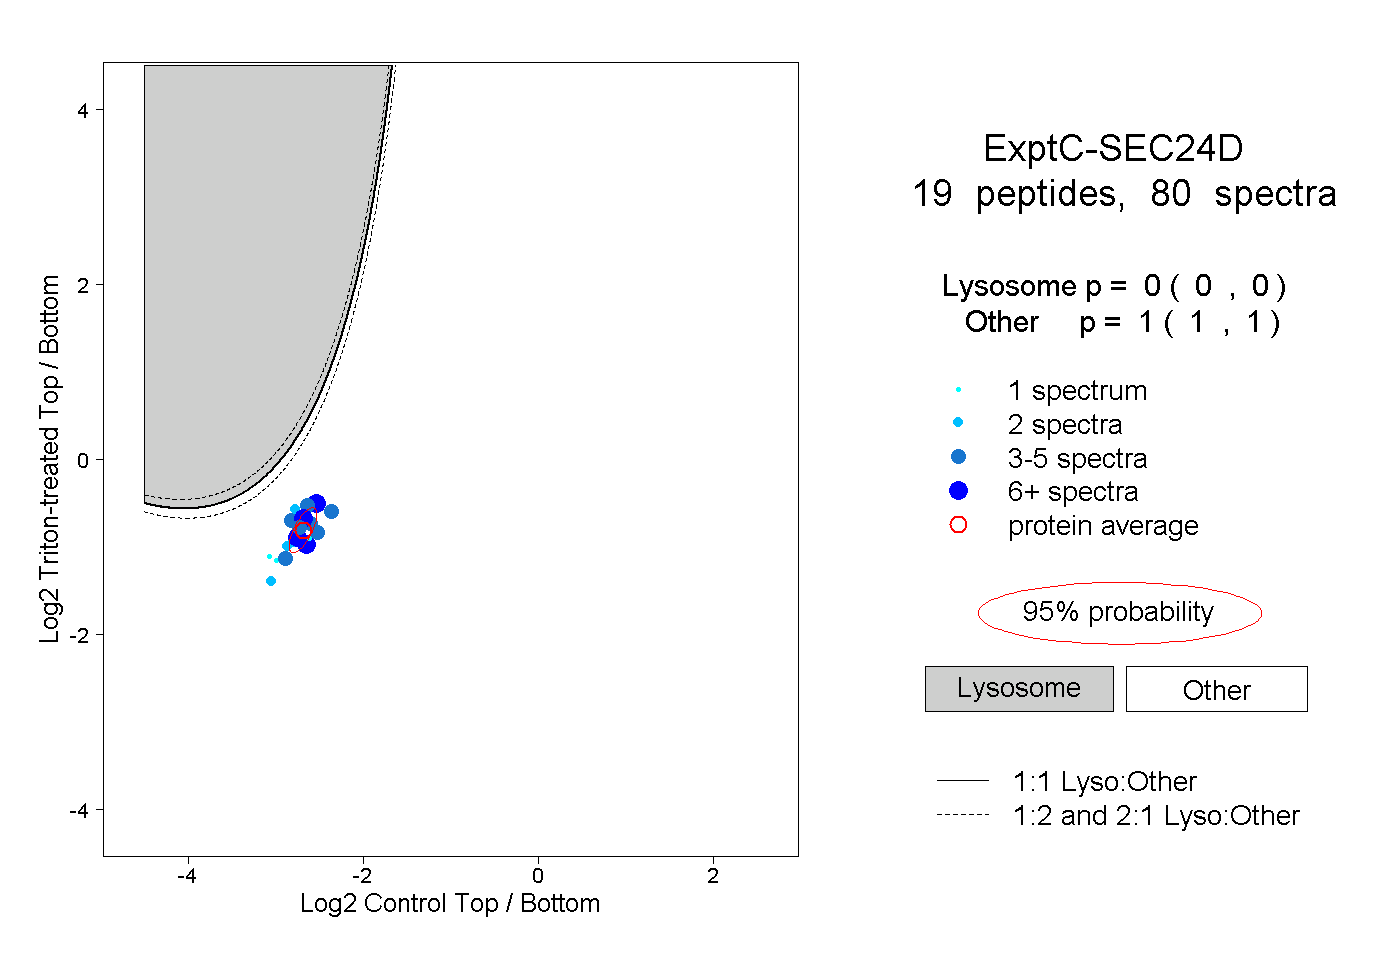
0.000 | 0.000
1.000 | 1.000