 8
8peptides
spectra
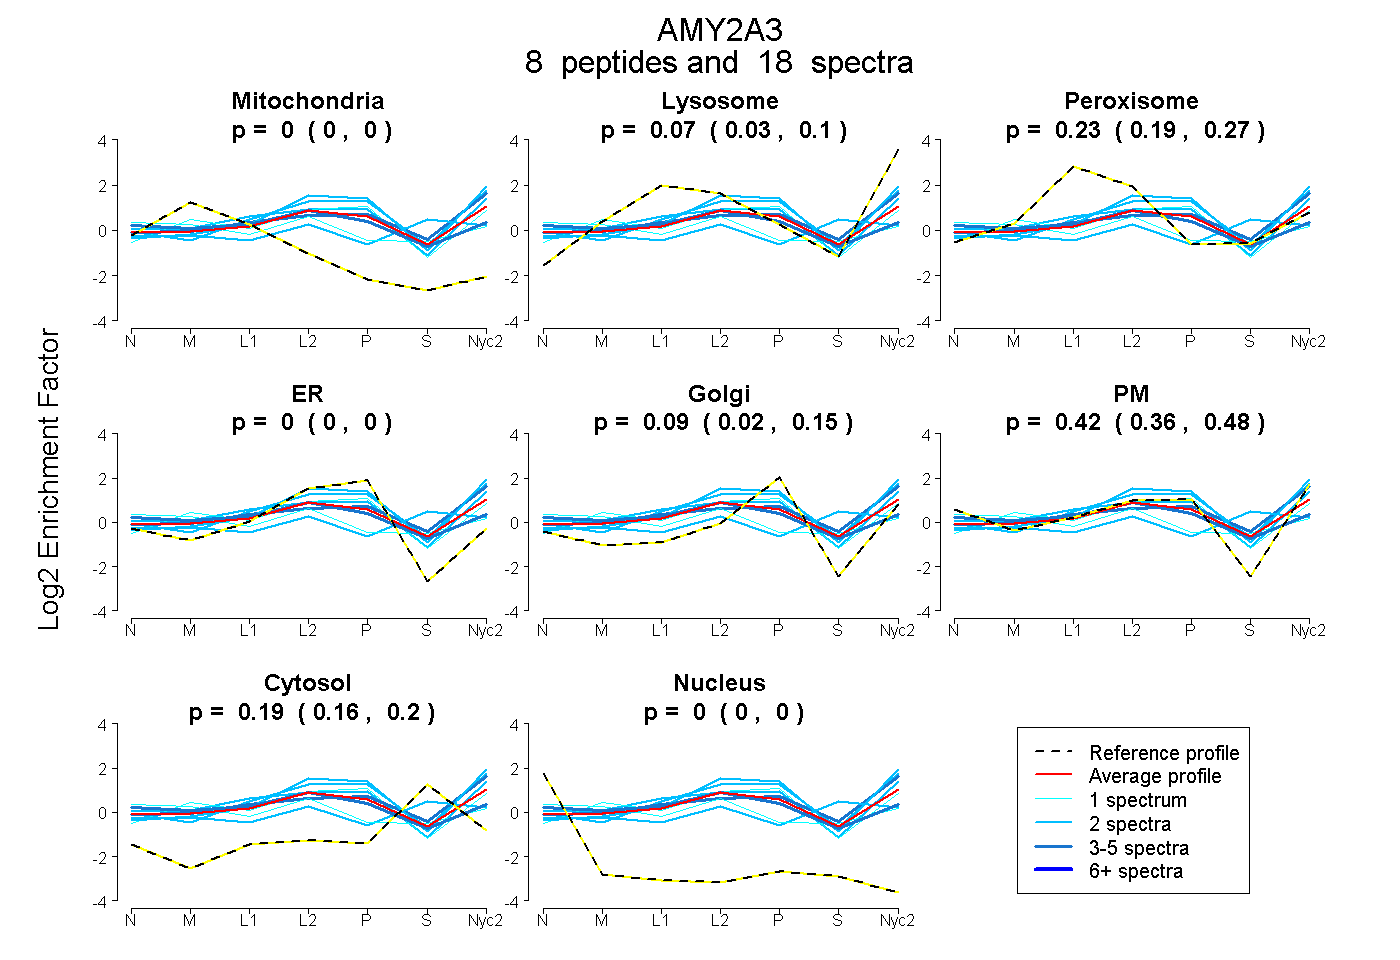
0.000 | 0.000
0.032 | 0.101
0.189 | 0.265
0.000 | 0.000
0.024 | 0.146
0.361 | 0.477
0.165 | 0.205
0.000 | 0.000
13peptides
spectra
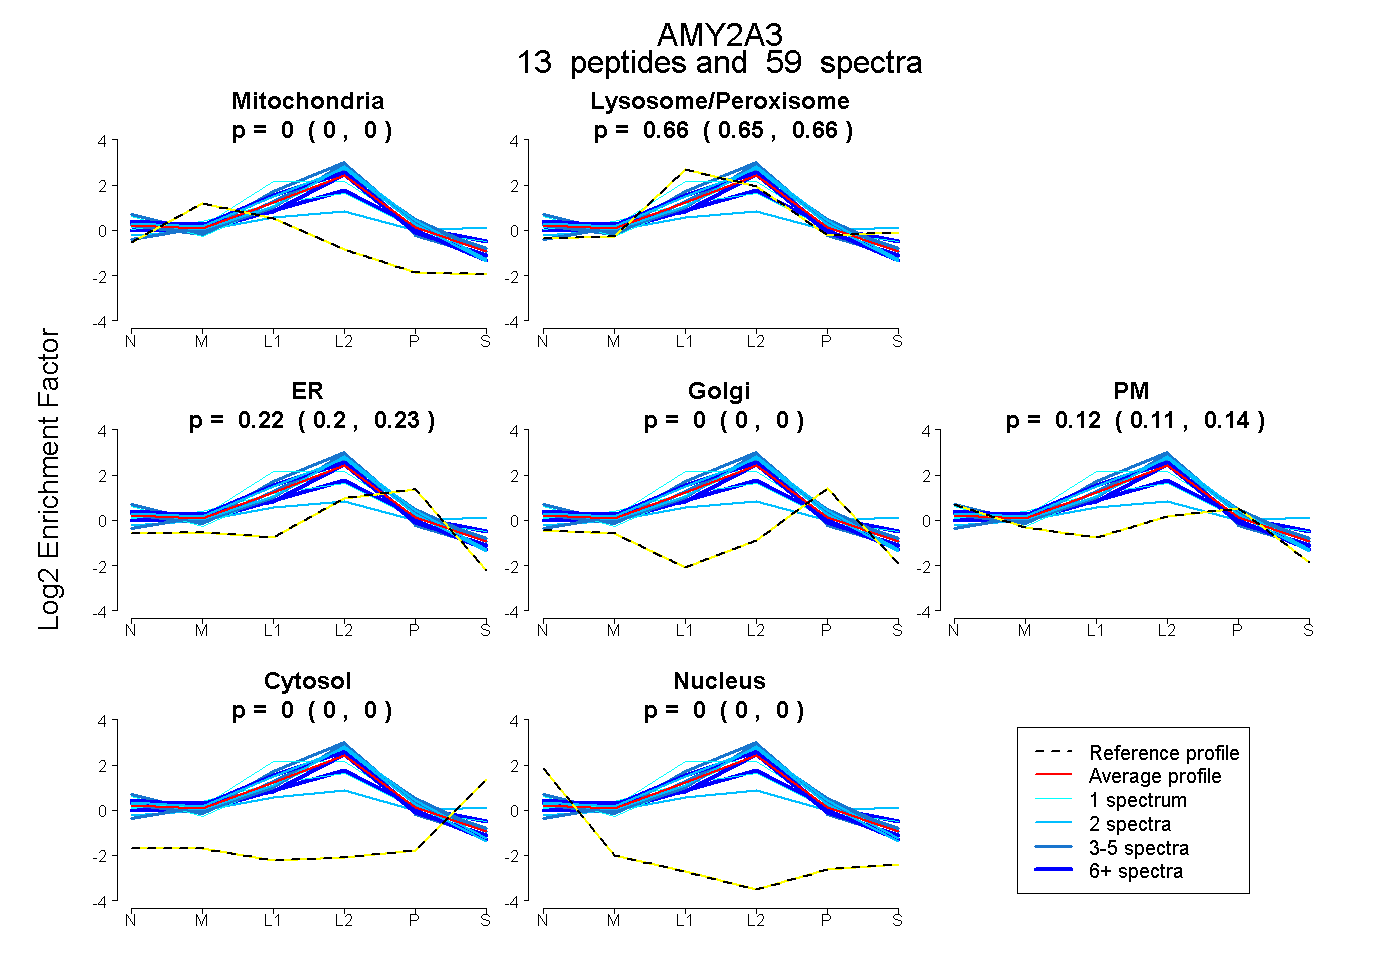
0.000 | 0.000
0.651 | 0.663
0.204 | 0.230
0.000 | 0.000
0.109 | 0.138
0.000 | 0.000
0.000 | 0.000
18peptides
spectra
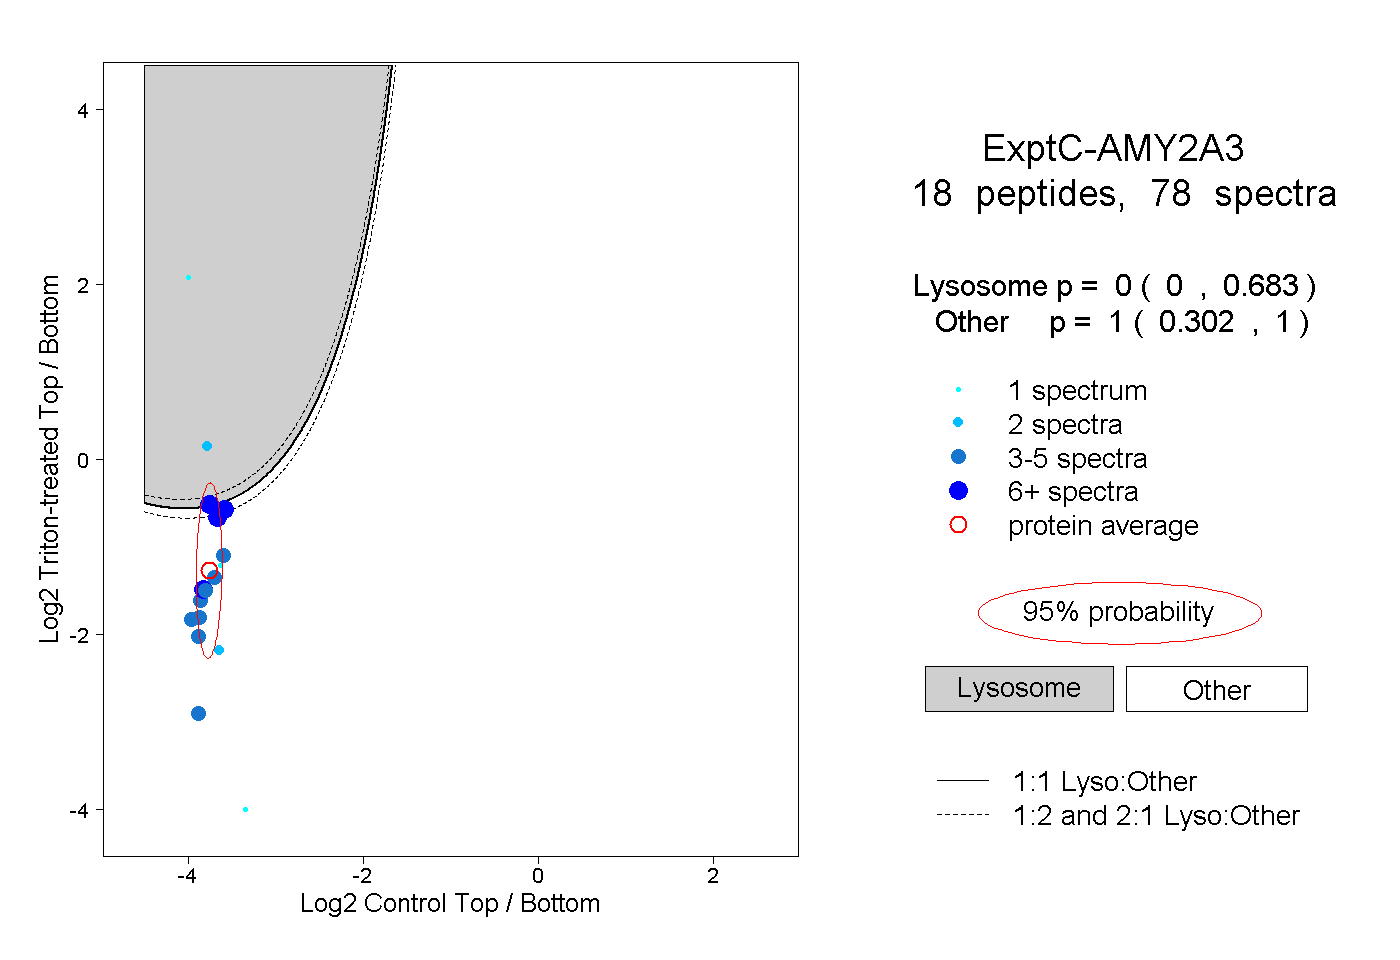
0.000 | 0.683
0.302 | 1.000
8peptides
spectra
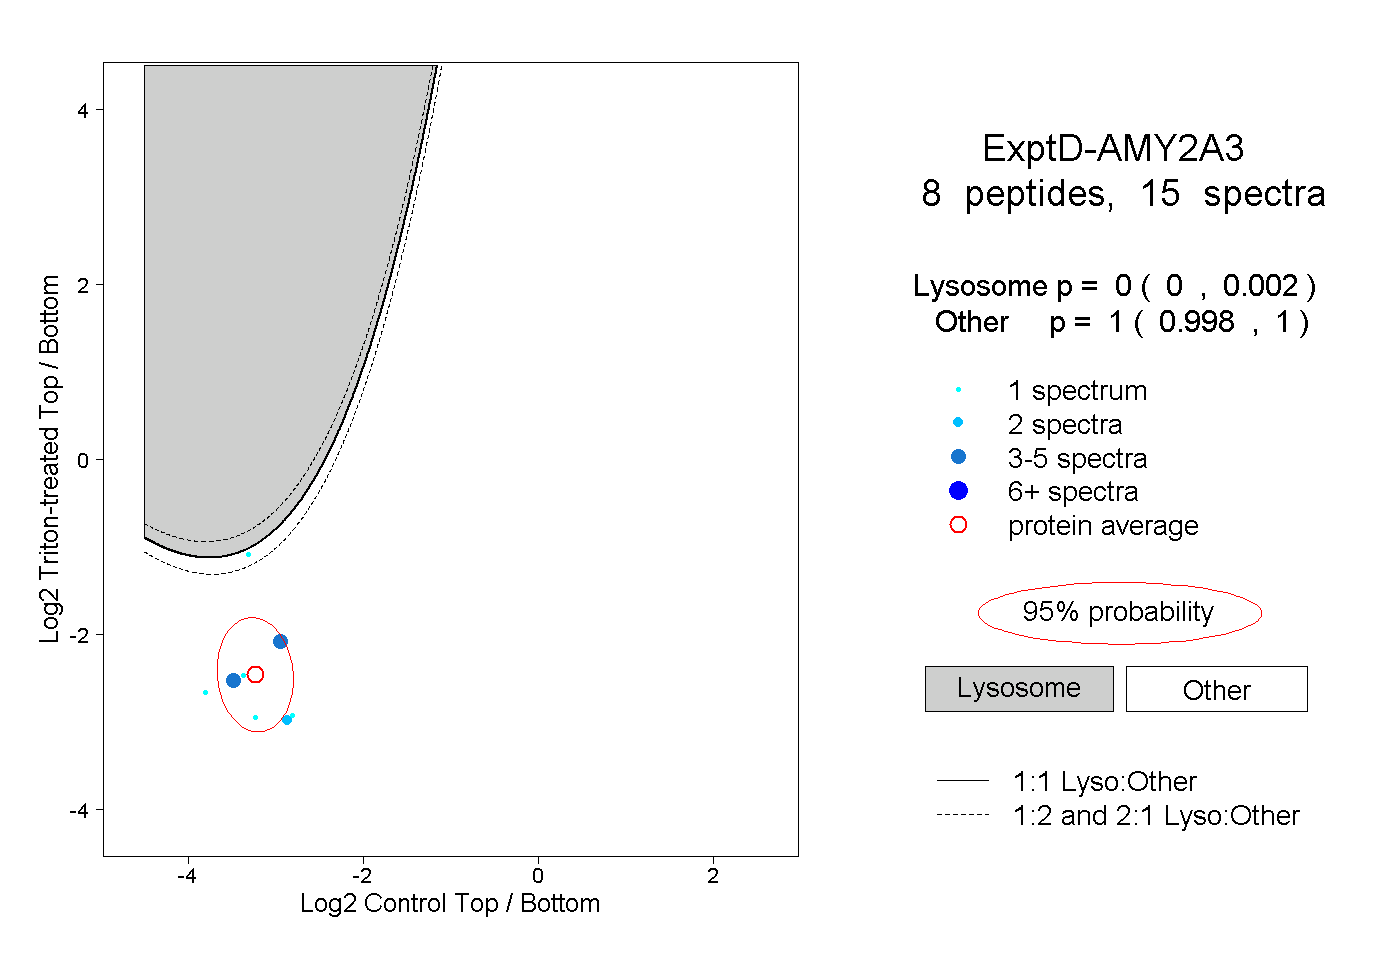
0.000 | 0.002
0.998 | 1.000