 4
4peptides
spectra
0.000 | 0.000
0.000 | 0.000
0.000 | 0.000
0.290 | 0.328
0.000 | 0.009
0.000 | 0.000
0.175 | 0.202
0.472 | 0.513
1peptide
spectra
NA | NA
NA | NA
NA | NA
NA | NA
NA | NA
NA | NA
NA | NA
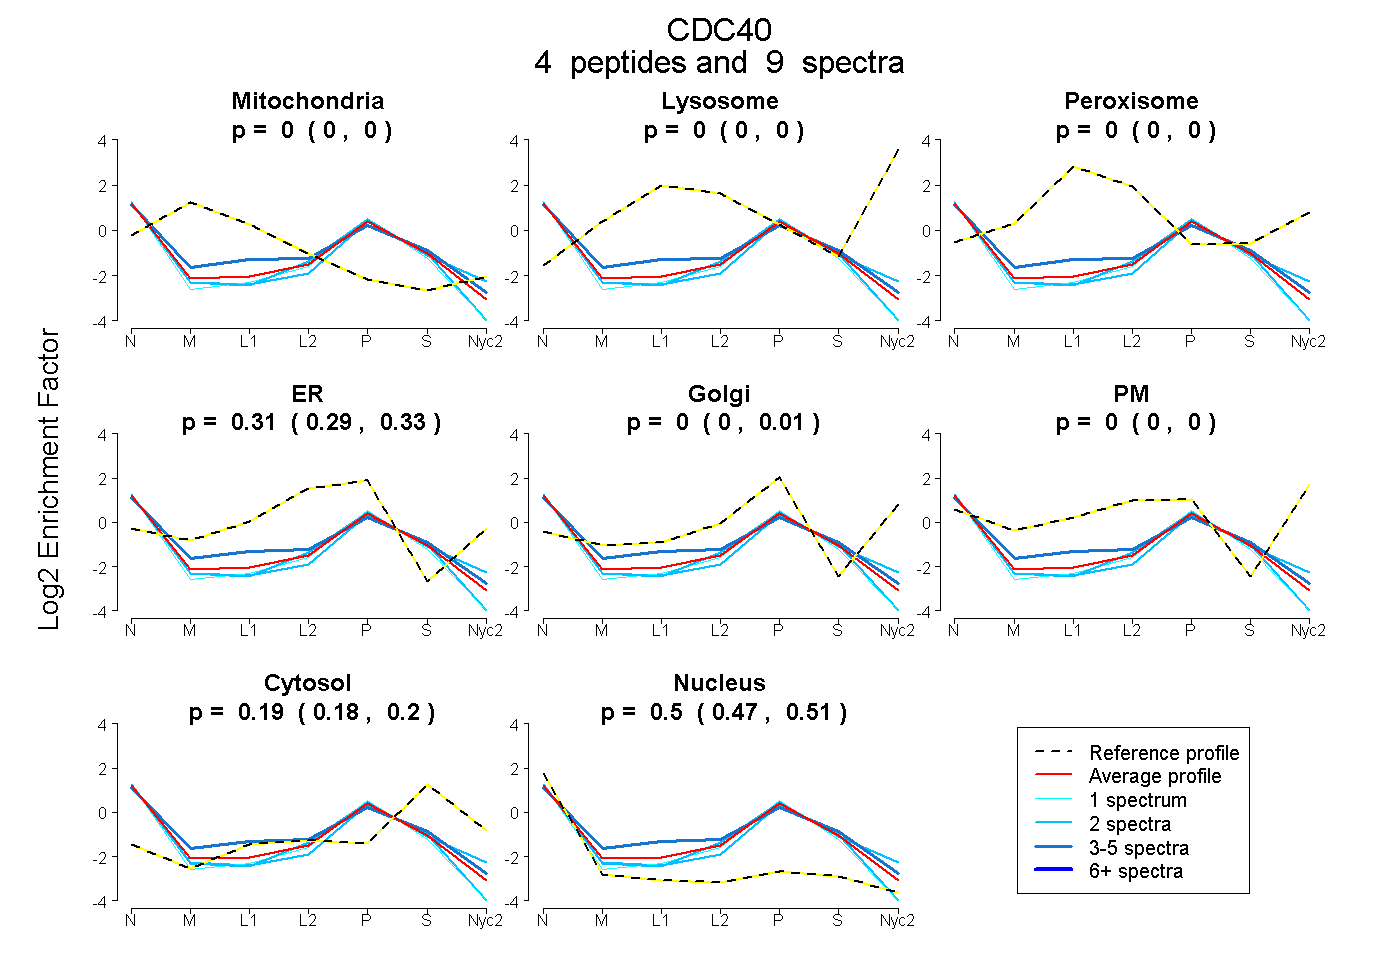
| Plot | Mito | Lyso | Perox | ER | Golgi | PM | Cytosol | Nucleus | |||||
| Expt A |
4 peptides |
9 spectra |
|
0.000 0.000 | 0.000 |
0.000 0.000 | 0.000 |
0.000 0.000 | 0.000 |
0.315 0.290 | 0.328 |
0.000 0.000 | 0.009 |
0.000 0.000 | 0.000 |
0.190 0.175 | 0.202 |
0.496 0.472 | 0.513 |
||
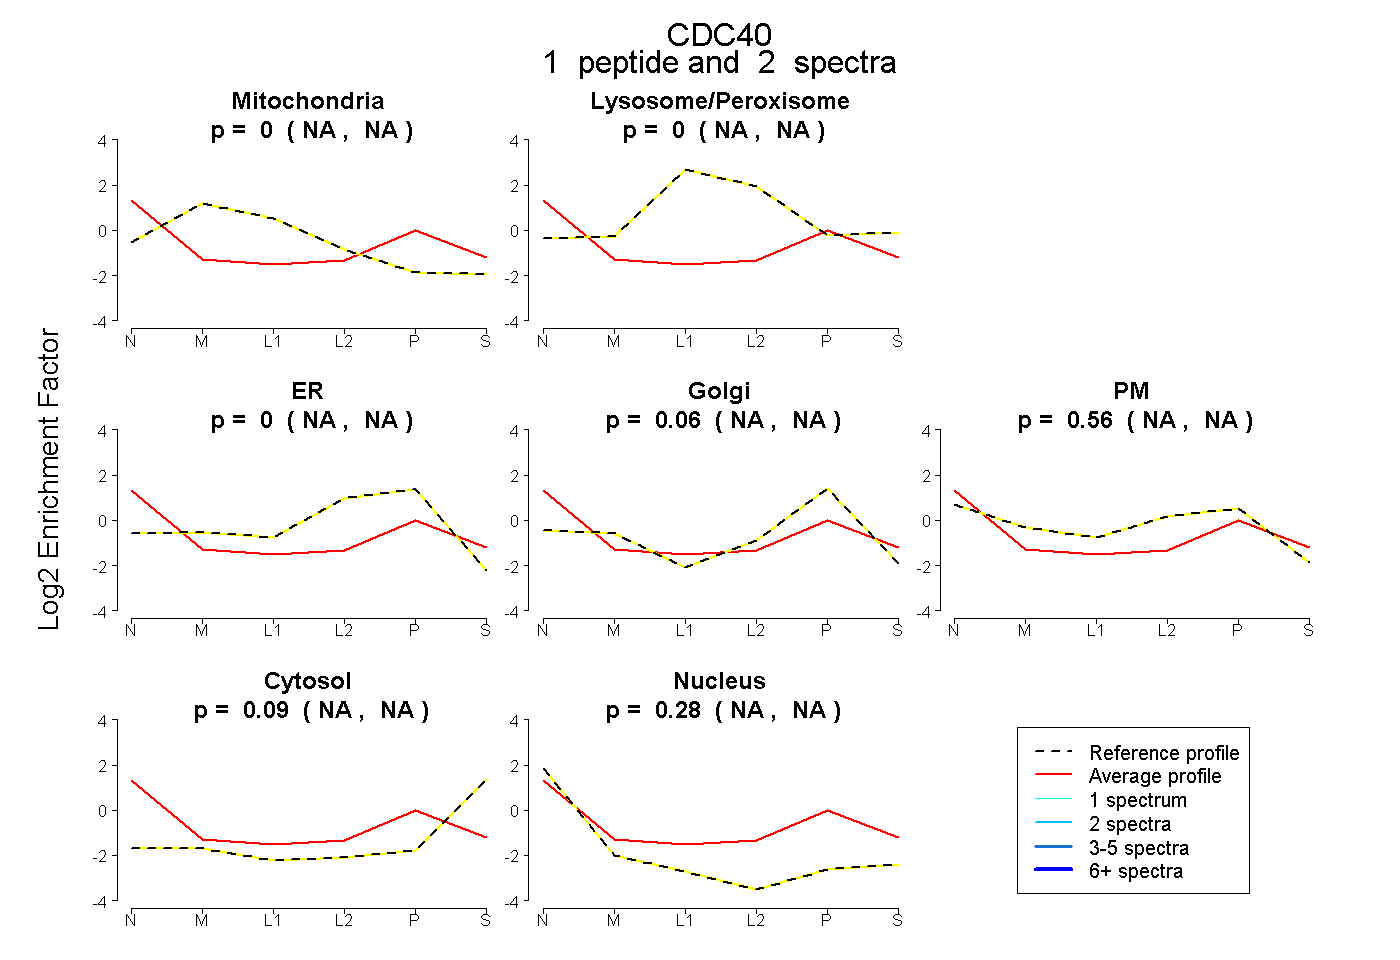
| Plot | Mito | Lyso or Perox | ER | Golgi | PM | Cytosol | Nucleus | ||||||
| Expt B |
1 peptide |
2 spectra |
|
0.000 NA | NA |
0.000 NA | NA |
0.000 NA | NA |
0.062 NA | NA |
0.563 NA | NA |
0.090 NA | NA |
0.284 NA | NA |