 20
20peptides
spectra
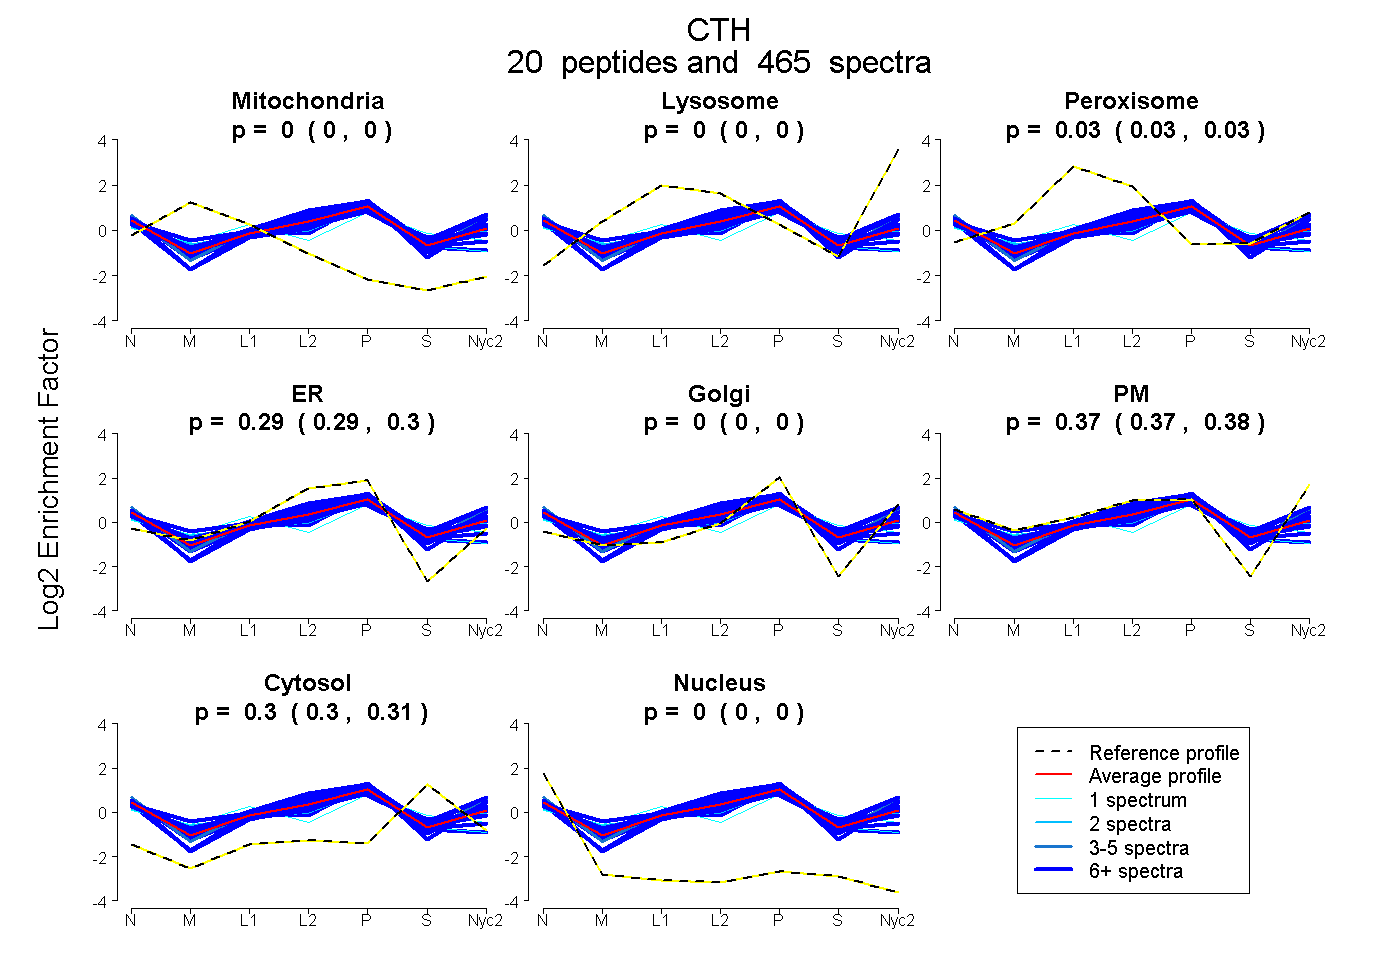
0.000 | 0.000
0.000 | 0.000
0.028 | 0.029
0.291 | 0.297
0.000 | 0.000
0.369 | 0.376
0.304 | 0.305
0.000 | 0.000
18peptides
spectra
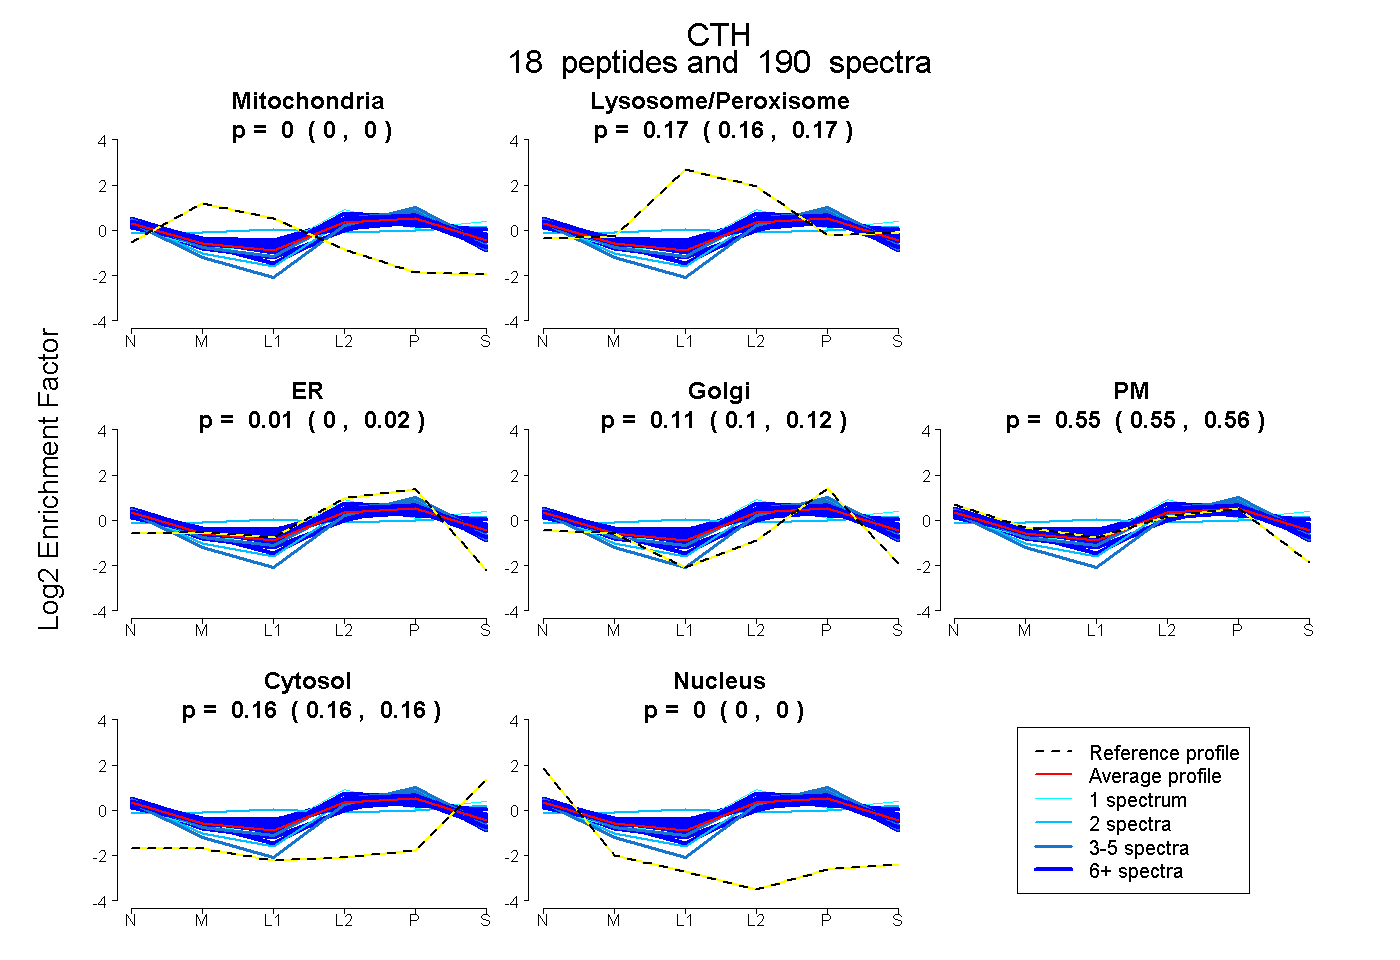
0.000 | 0.000
0.161 | 0.171
0.000 | 0.017
0.099 | 0.120
0.548 | 0.558
0.158 | 0.164
0.000 | 0.000
18peptides
spectra
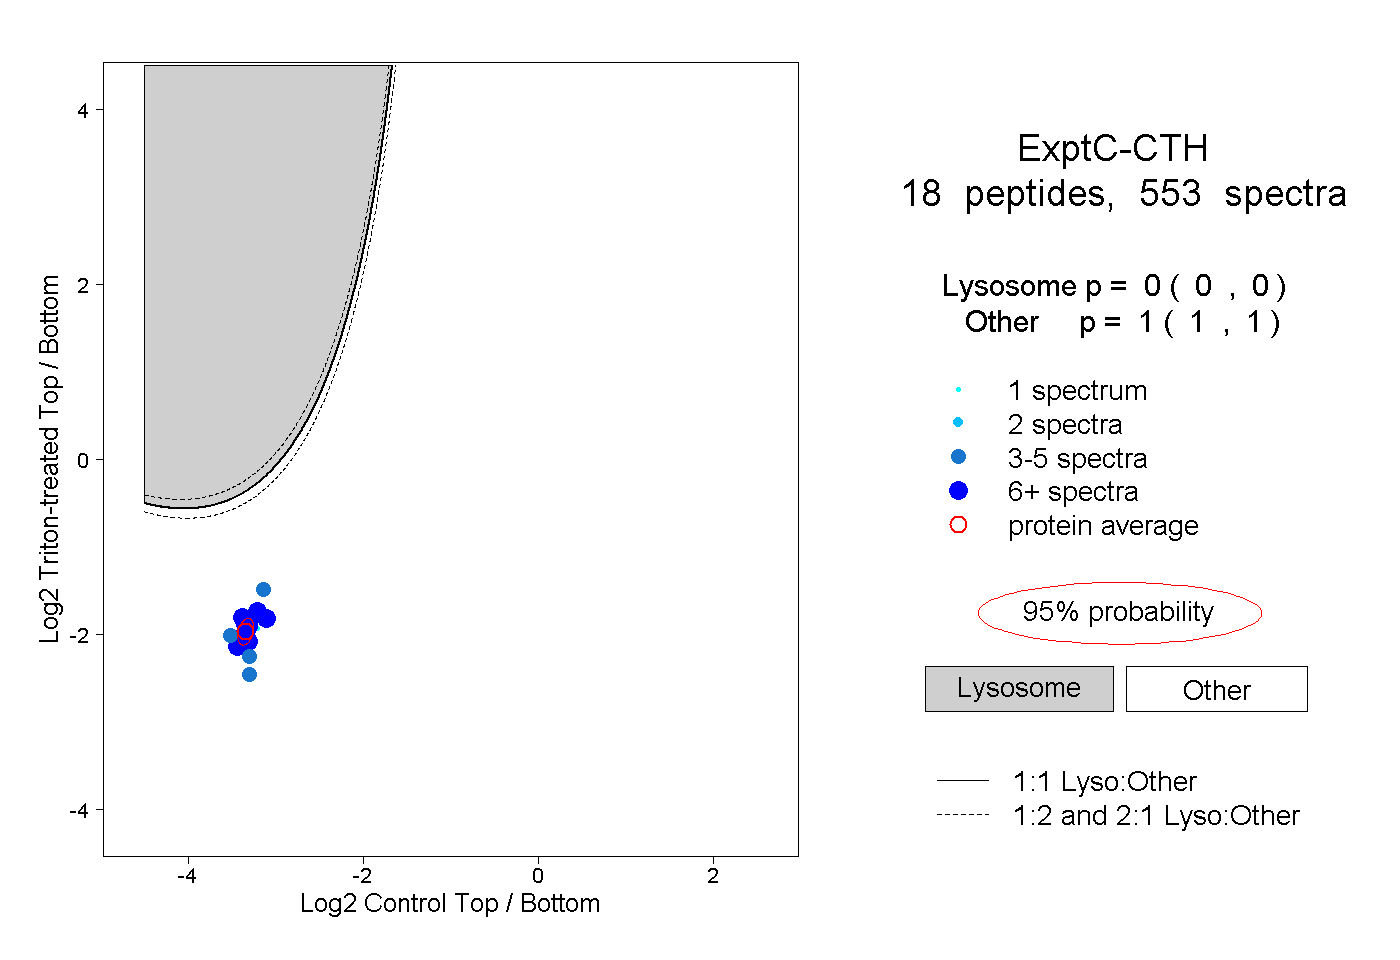
0.000 | 0.000
1.000 | 1.000
15peptides
spectra
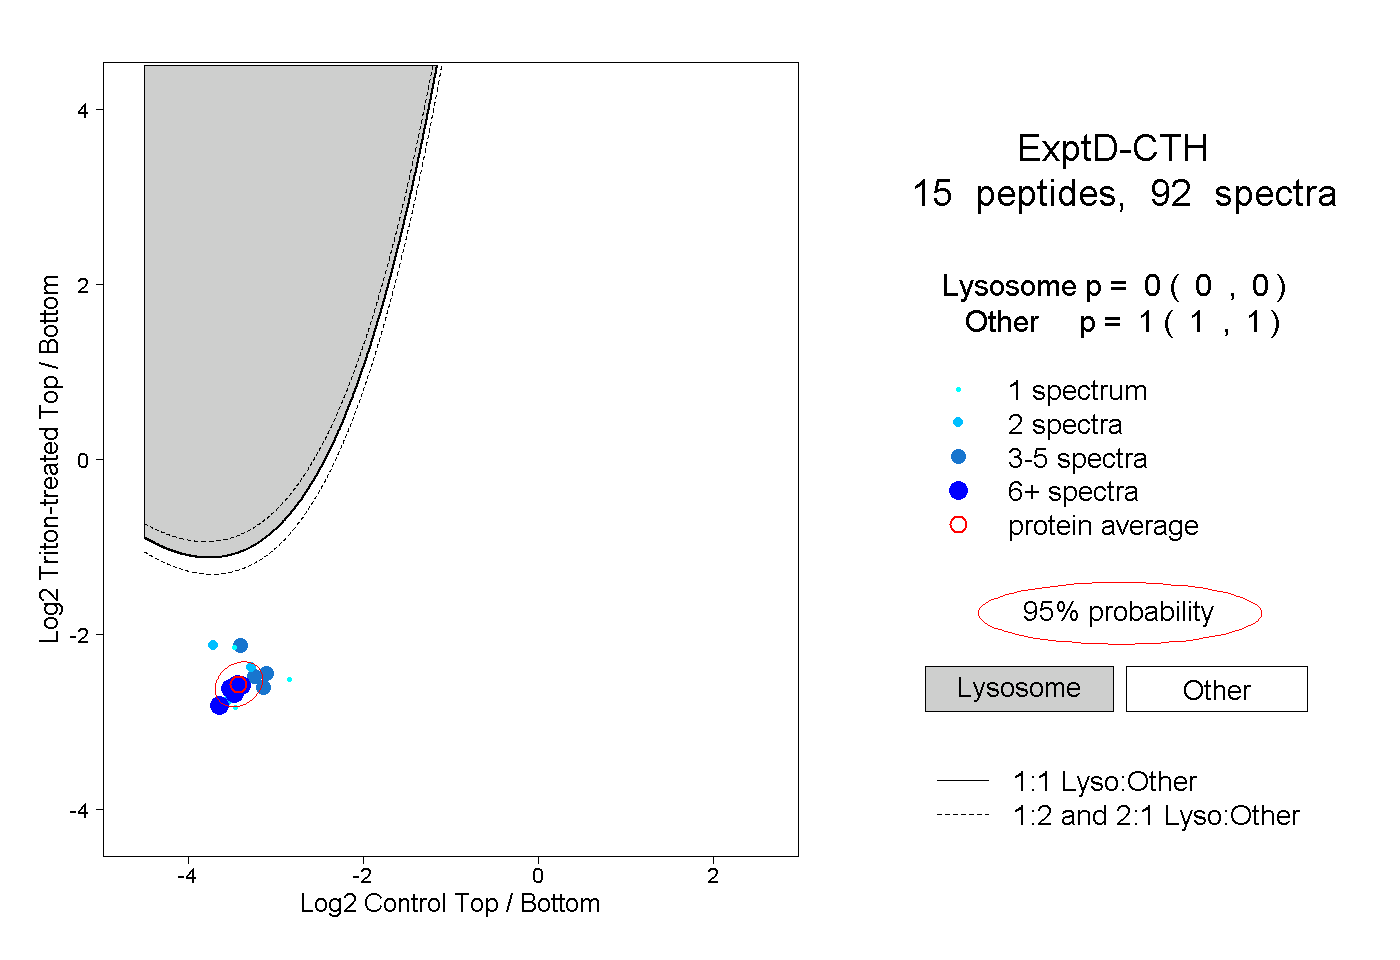
0.000 | 0.000
1.000 | 1.000