 30
30peptides
spectra
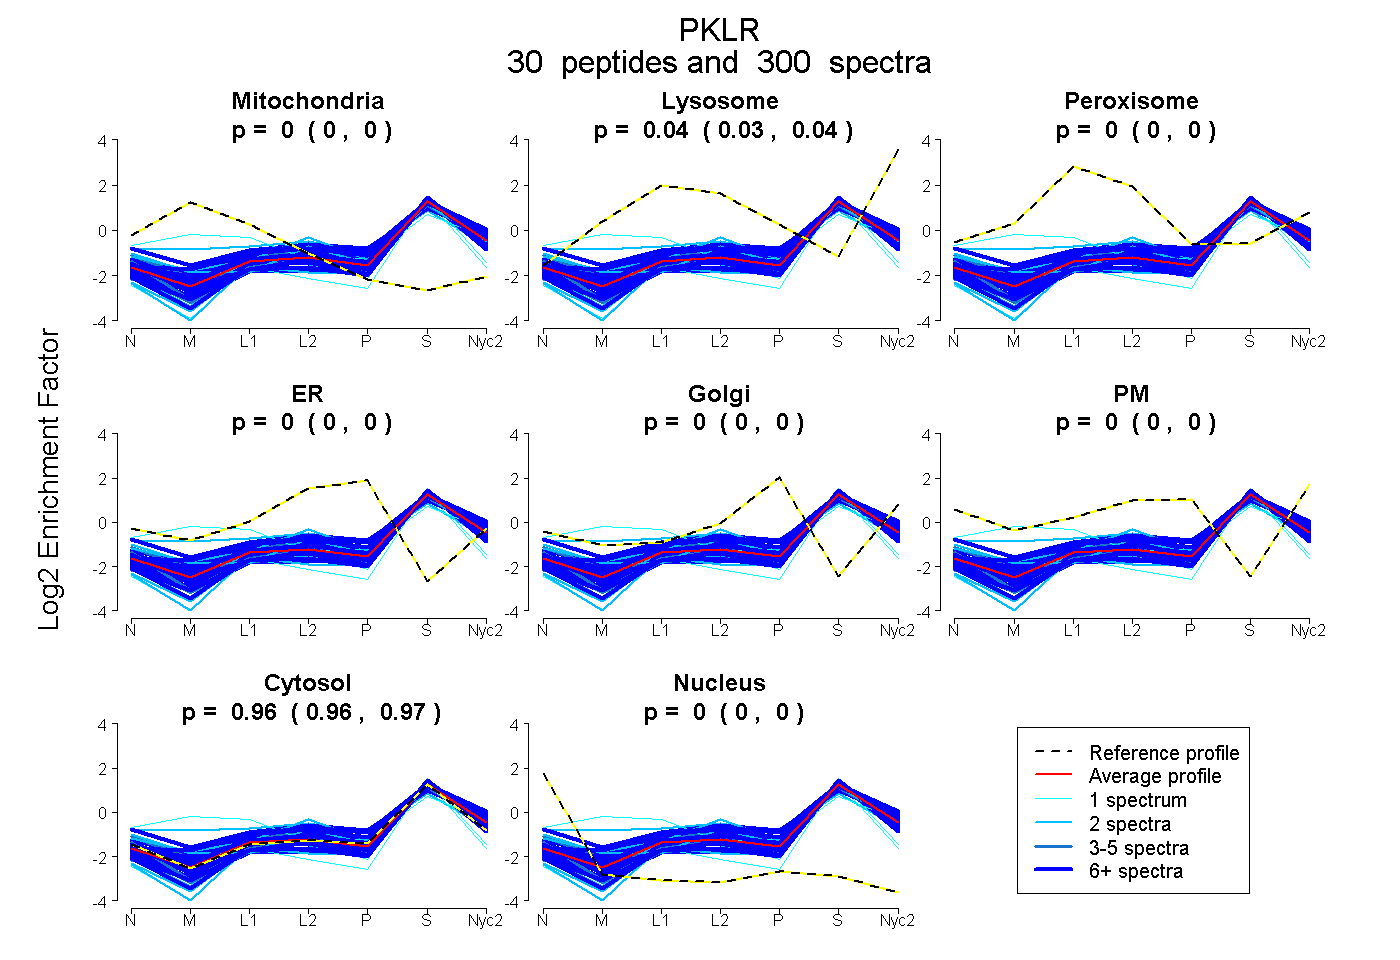
0.000 | 0.000
0.034 | 0.036
0.000 | 0.000
0.000 | 0.000
0.000 | 0.000
0.000 | 0.000
0.964 | 0.966
0.000 | 0.000
21peptides
spectra

0.000 | 0.000
0.000 | 0.000
0.000 | 0.000
0.000 | 0.000
0.000 | 0.000
1.000 | 1.000
0.000 | 0.000
26peptides
spectra
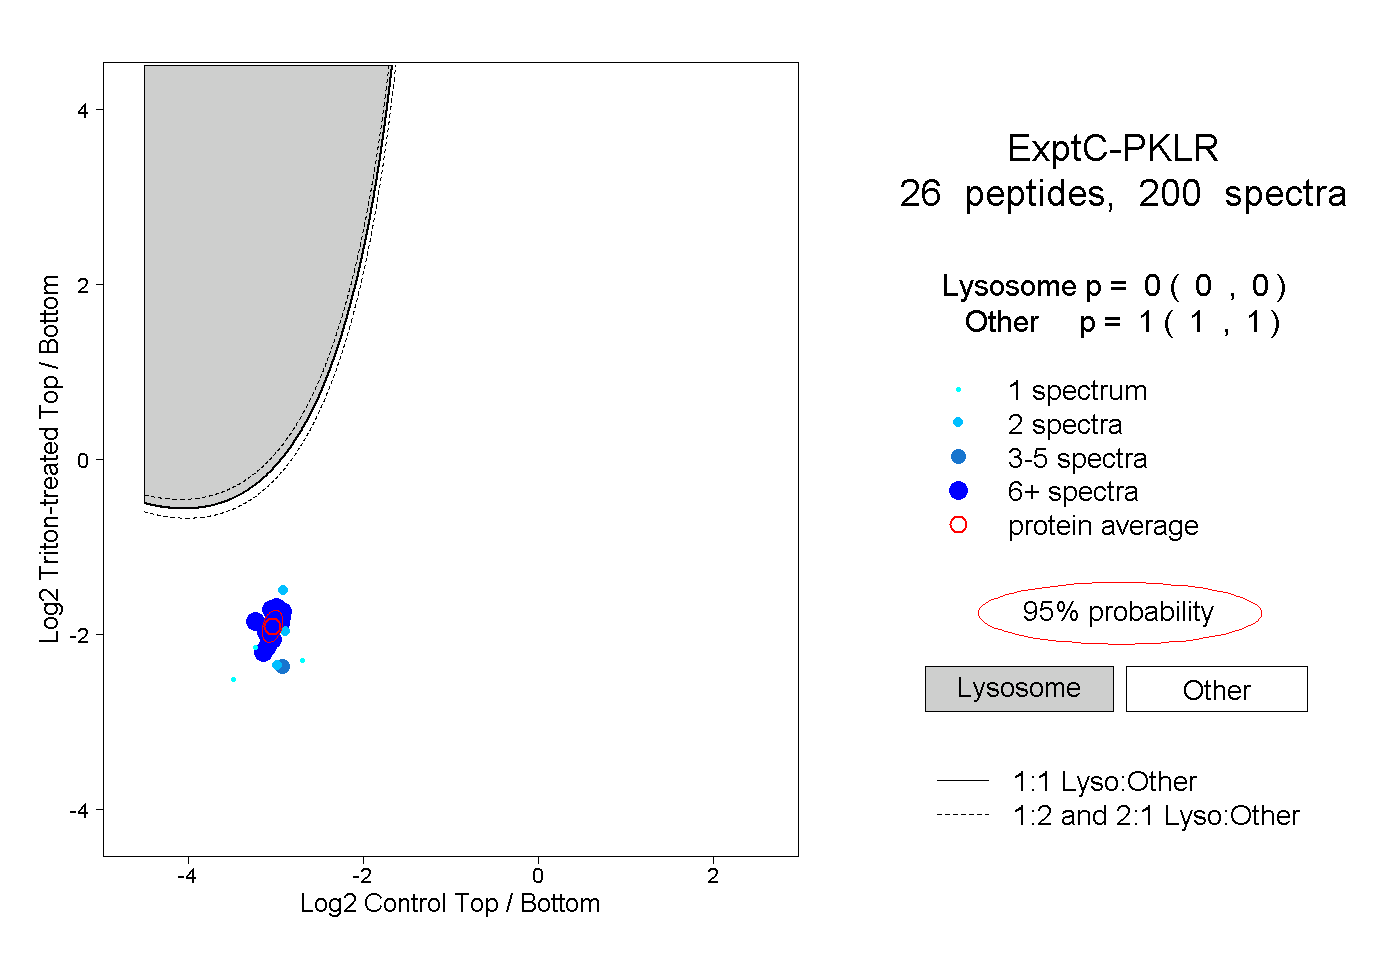
0.000 | 0.000
1.000 | 1.000
7peptides
spectra
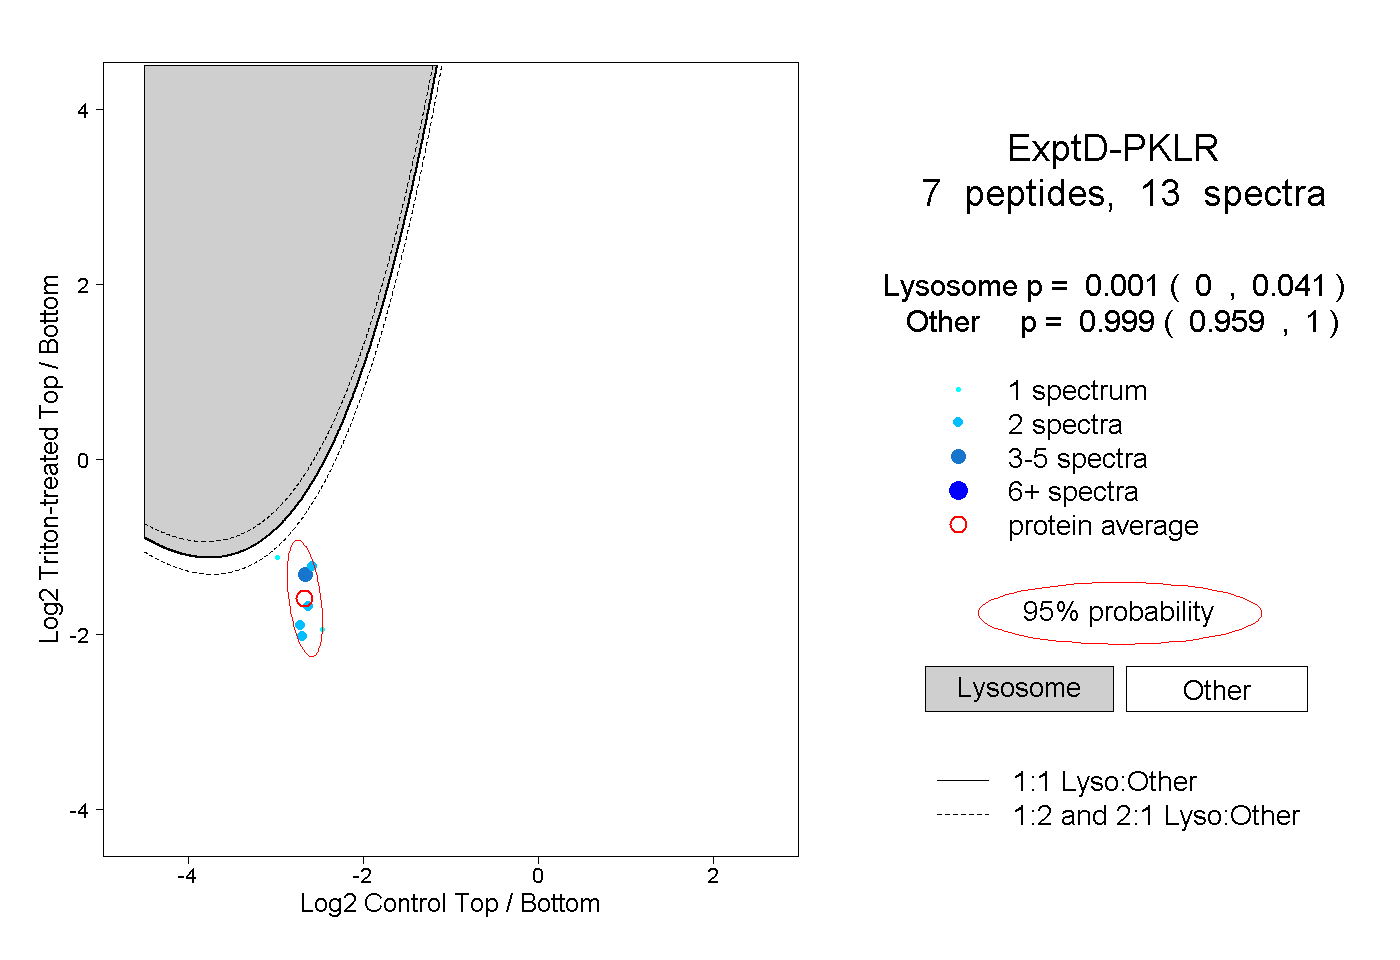
0.000 | 0.041
0.959 | 1.000