 10
10peptides
spectra
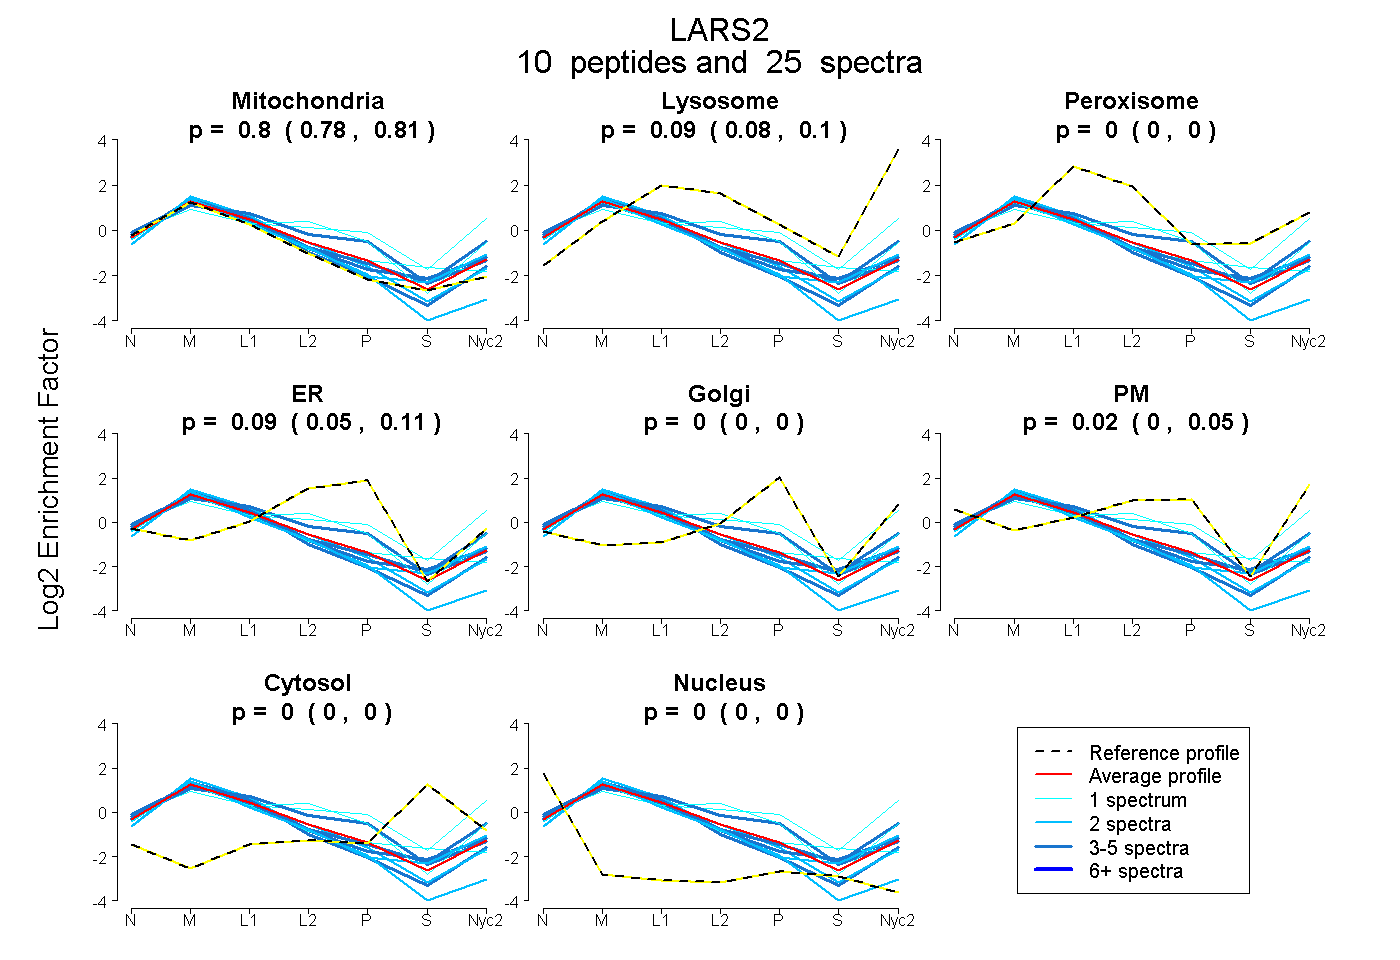
0.783 | 0.808
0.080 | 0.103
0.000 | 0.000
0.054 | 0.113
0.000 | 0.000
0.000 | 0.049
0.000 | 0.000
0.000 | 0.000
3peptides
spectra
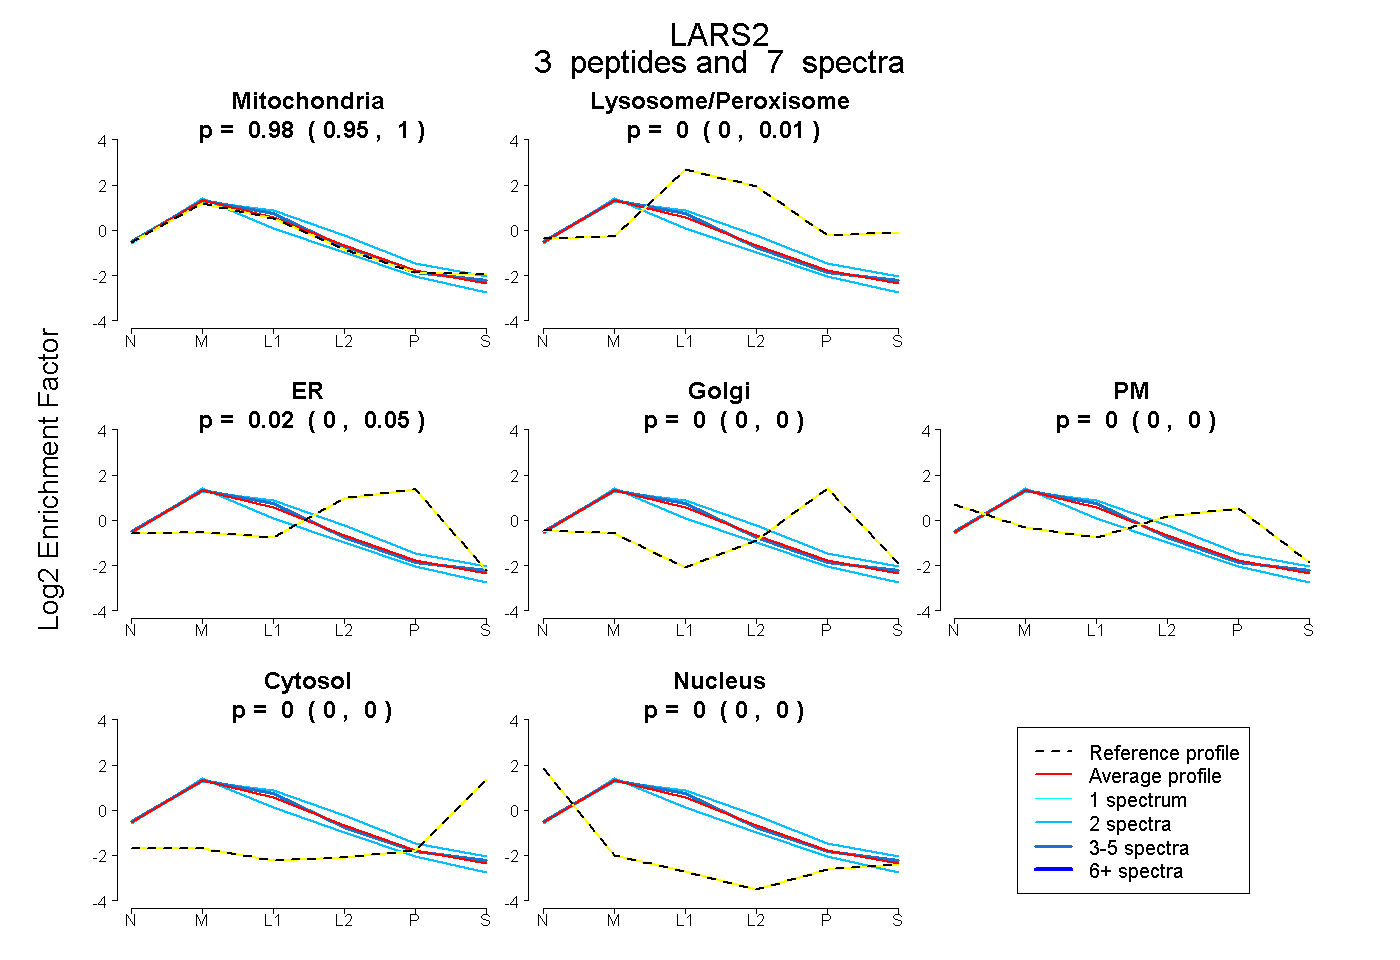
0.946 | 1.000
0.000 | 0.010
0.000 | 0.047
0.000 | 0.000
0.000 | 0.000
0.000 | 0.000
0.000 | 0.000
18peptides
spectra
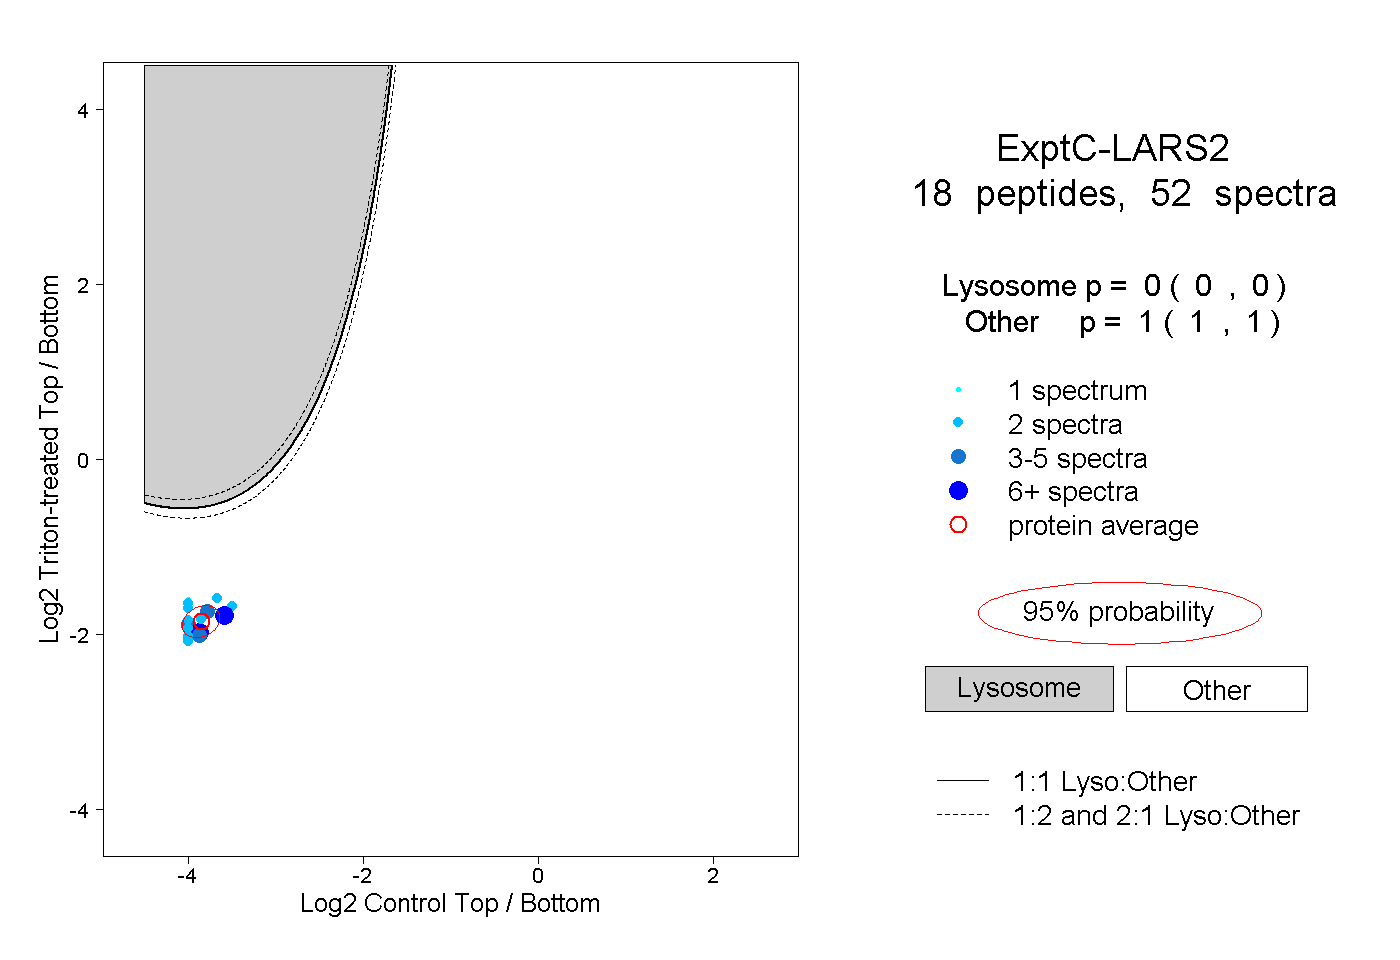
0.000 | 0.000
1.000 | 1.000
5peptides
spectra
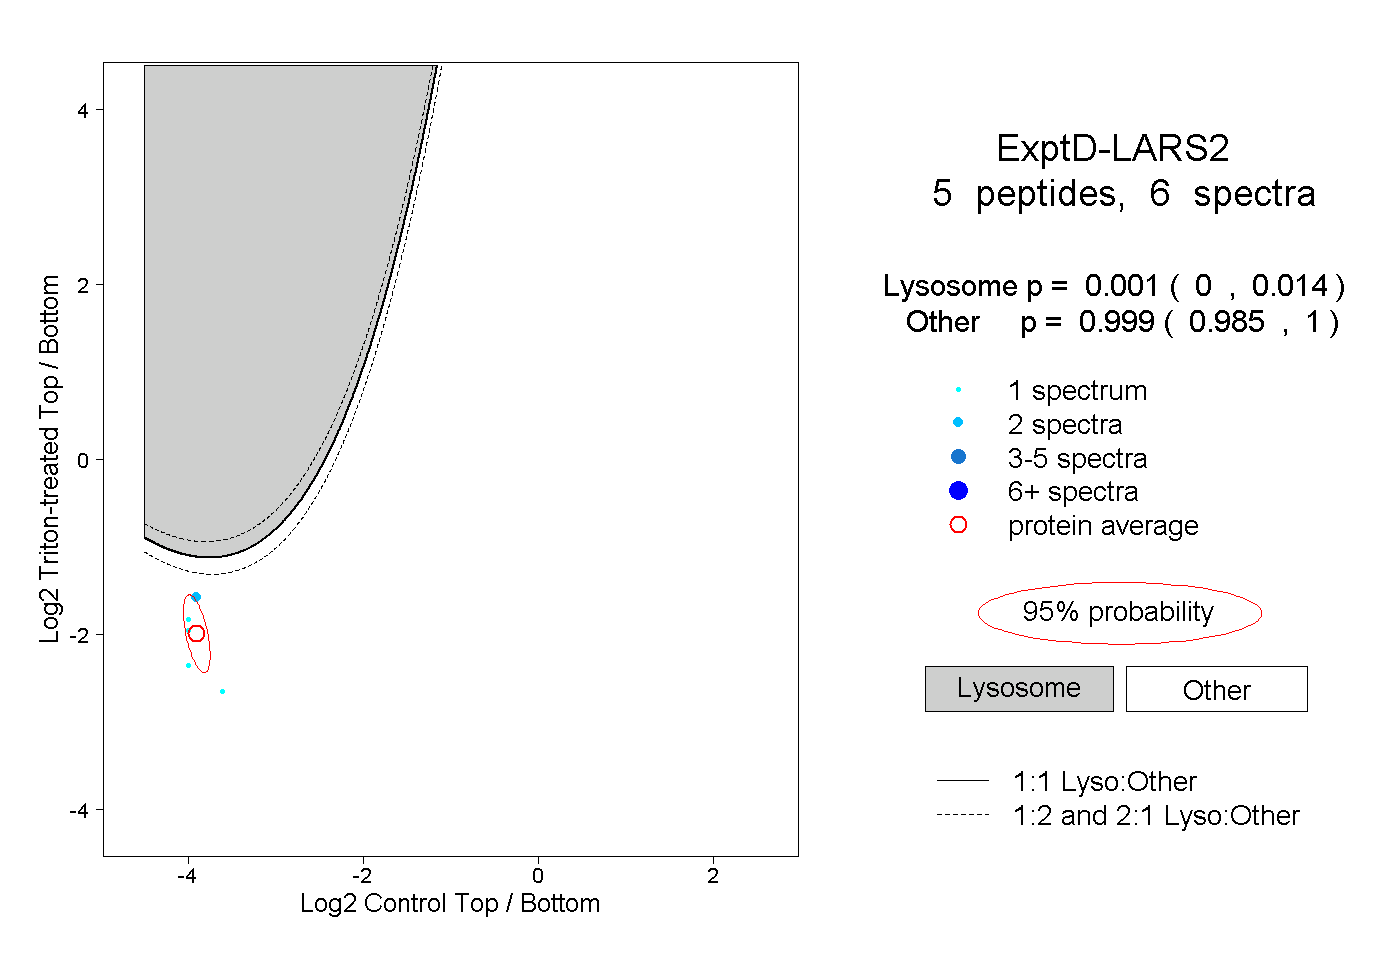
0.000 | 0.014
0.985 | 1.000