 25
25peptides
spectra
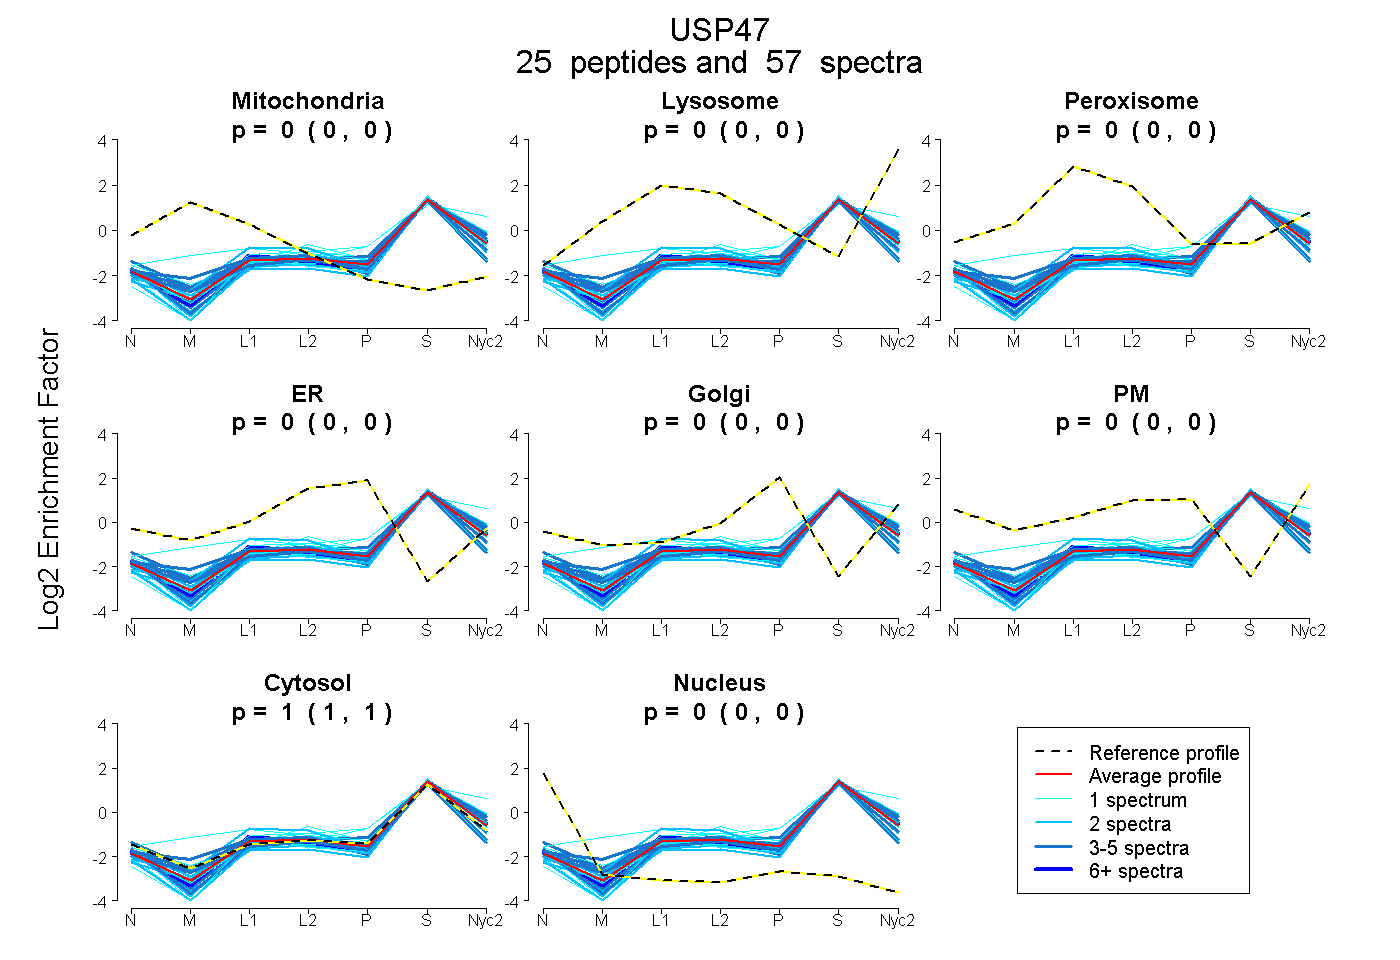
0.000 | 0.000
0.000 | 0.000
0.000 | 0.000
0.000 | 0.000
0.000 | 0.000
0.000 | 0.000
1.000 | 1.000
0.000 | 0.000
| Plot | Mito | Lyso | Perox | ER | Golgi | PM | Cytosol | Nucleus | |||||
| Expt A |
25 peptides |
57 spectra |
|
0.000 0.000 | 0.000 |
0.000 0.000 | 0.000 |
0.000 0.000 | 0.000 |
0.000 0.000 | 0.000 |
0.000 0.000 | 0.000 |
0.000 0.000 | 0.000 |
1.000 1.000 | 1.000 |
0.000 0.000 | 0.000 |
| 1 spectrum, EAVEMAYK | 0.000 | 0.010 | 0.000 | 0.000 | 0.076 | 0.000 | 0.914 | 0.000 | ||
| 1 spectrum, AEGFFR | 0.000 | 0.000 | 0.000 | 0.000 | 0.000 | 0.000 | 1.000 | 0.000 | ||
| 1 spectrum, SYEGEEDTPMGLLLGGVK | 0.000 | 0.000 | 0.000 | 0.000 | 0.000 | 0.000 | 1.000 | 0.000 | ||
| 1 spectrum, VMFDALEQK | 0.000 | 0.023 | 0.000 | 0.000 | 0.000 | 0.000 | 0.977 | 0.000 | ||
| 2 spectra, VHVVDLK | 0.000 | 0.046 | 0.036 | 0.000 | 0.000 | 0.000 | 0.918 | 0.000 | ||
| 4 spectra, YDEFHDYLER | 0.027 | 0.019 | 0.000 | 0.000 | 0.000 | 0.000 | 0.954 | 0.000 | ||
| 4 spectra, AIETTDVTR | 0.000 | 0.031 | 0.006 | 0.000 | 0.000 | 0.000 | 0.963 | 0.000 | ||
| 1 spectrum, EIEEQEK | 0.000 | 0.062 | 0.000 | 0.000 | 0.000 | 0.000 | 0.938 | 0.000 | ||
| 3 spectra, ITVNLPASTPVR | 0.000 | 0.000 | 0.000 | 0.000 | 0.000 | 0.000 | 1.000 | 0.000 | ||
| 2 spectra, FLLDAVFAK | 0.000 | 0.000 | 0.000 | 0.000 | 0.000 | 0.000 | 1.000 | 0.000 | ||
| 3 spectra, VYTSNQEFETVR | 0.000 | 0.004 | 0.000 | 0.000 | 0.000 | 0.000 | 0.996 | 0.000 | ||
| 2 spectra, STYMFDLLLETR | 0.000 | 0.000 | 0.000 | 0.000 | 0.000 | 0.000 | 1.000 | 0.000 | ||
| 4 spectra, AETVAAPVTVR | 0.000 | 0.000 | 0.000 | 0.000 | 0.000 | 0.000 | 1.000 | 0.000 | ||
| 1 spectrum, LLSMPSK | 0.000 | 0.246 | 0.000 | 0.000 | 0.000 | 0.000 | 0.754 | 0.000 | ||
| 3 spectra, SMSQLAILTR | 0.000 | 0.043 | 0.000 | 0.000 | 0.000 | 0.000 | 0.957 | 0.000 | ||
| 3 spectra, EQCGLDLSIDR | 0.000 | 0.000 | 0.000 | 0.000 | 0.000 | 0.000 | 1.000 | 0.000 | ||
| 2 spectra, FLEVDEYPEHIK | 0.000 | 0.000 | 0.000 | 0.000 | 0.000 | 0.000 | 1.000 | 0.000 | ||
| 1 spectrum, SFGWDSSEAWQQHDVQELCR | 0.000 | 0.000 | 0.000 | 0.036 | 0.000 | 0.000 | 0.964 | 0.000 | ||
| 2 spectra, SVDAILEESTEK | 0.000 | 0.000 | 0.000 | 0.000 | 0.000 | 0.000 | 1.000 | 0.000 | ||
| 1 spectrum, ADPYTADEGSGEGHK | 0.000 | 0.000 | 0.000 | 0.000 | 0.000 | 0.000 | 1.000 | 0.000 | ||
| 2 spectra, FIGPLPR | 0.000 | 0.043 | 0.000 | 0.000 | 0.000 | 0.000 | 0.957 | 0.000 | ||
| 2 spectra, GSSTSVDNR | 0.000 | 0.000 | 0.000 | 0.000 | 0.000 | 0.000 | 1.000 | 0.000 | ||
| 1 spectrum, ELEQHIQTSDPENFQSEER | 0.000 | 0.000 | 0.000 | 0.000 | 0.000 | 0.000 | 0.983 | 0.017 | ||
| 4 spectra, LFCLHPVK | 0.017 | 0.000 | 0.000 | 0.000 | 0.000 | 0.000 | 0.983 | 0.000 | ||
| 6 spectra, EIENAAEEPR | 0.000 | 0.000 | 0.000 | 0.000 | 0.000 | 0.000 | 1.000 | 0.000 |
| Plot | Mito | Lyso or Perox | ER | Golgi | PM | Cytosol | Nucleus | ||||||
| Expt B |
9 peptides |
13 spectra |
 |
0.000 0.000 | 0.000 |
0.000 0.000 | 0.000 |
0.000 0.000 | 0.000 |
0.000 0.000 | 0.000 |
0.000 0.000 | 0.000 |
1.000 1.000 | 1.000 |
0.000 0.000 | 0.000 |
|||
| Plot | Lyso | Other | |||||||||||
| Expt C |
19 peptides |
36 spectra |
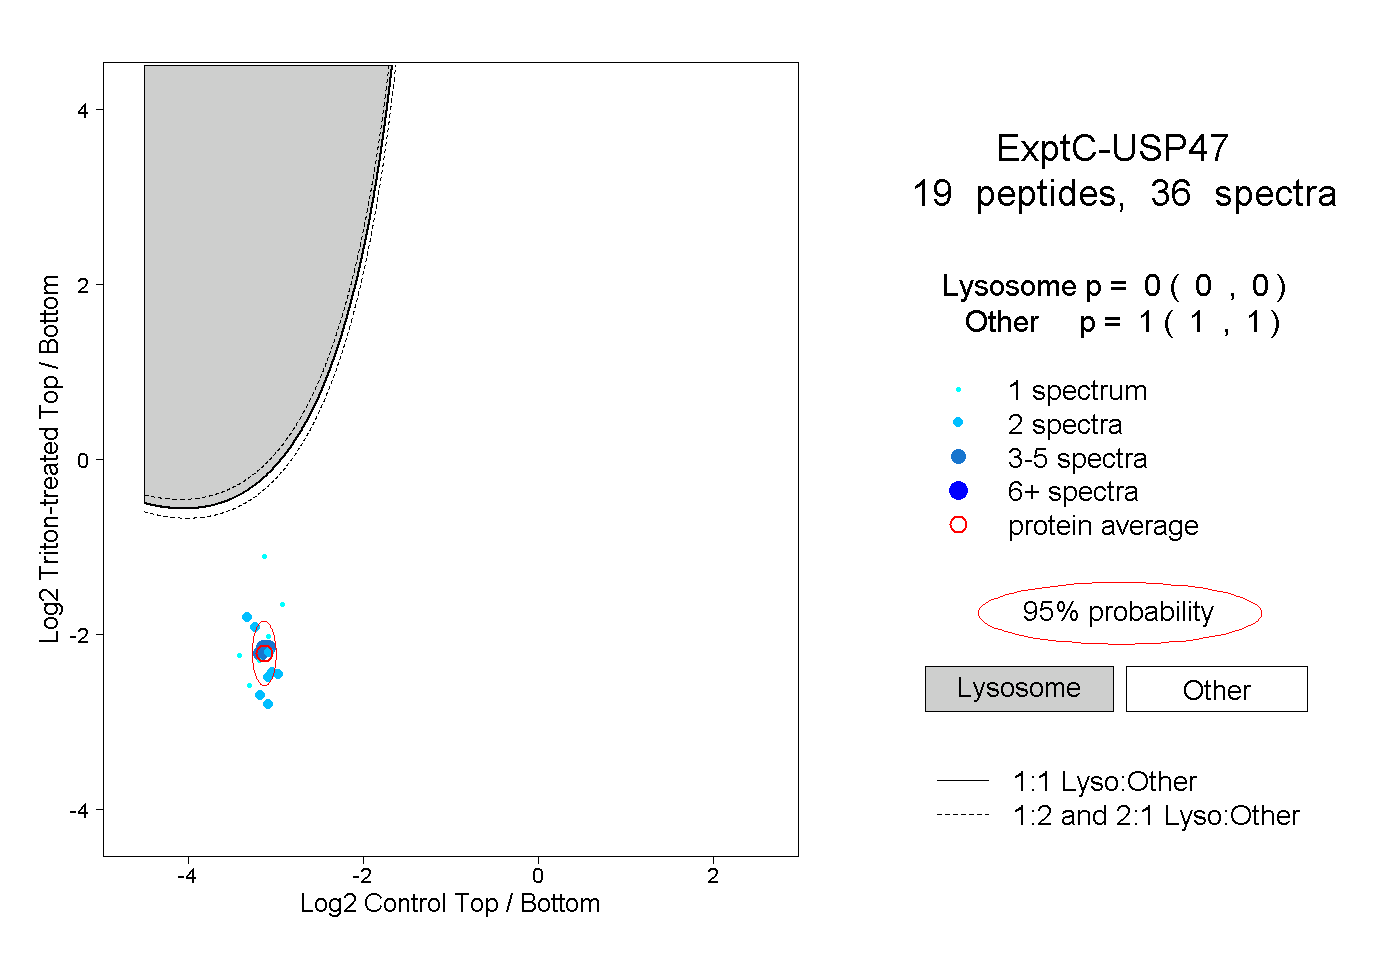 |
0.000 0.000 | 0.000 |
1.000 1.000 | 1.000 |
||||||||
| Plot | Lyso | Other | |||||||||||
| Expt D |
1 peptide |
2 spectra |
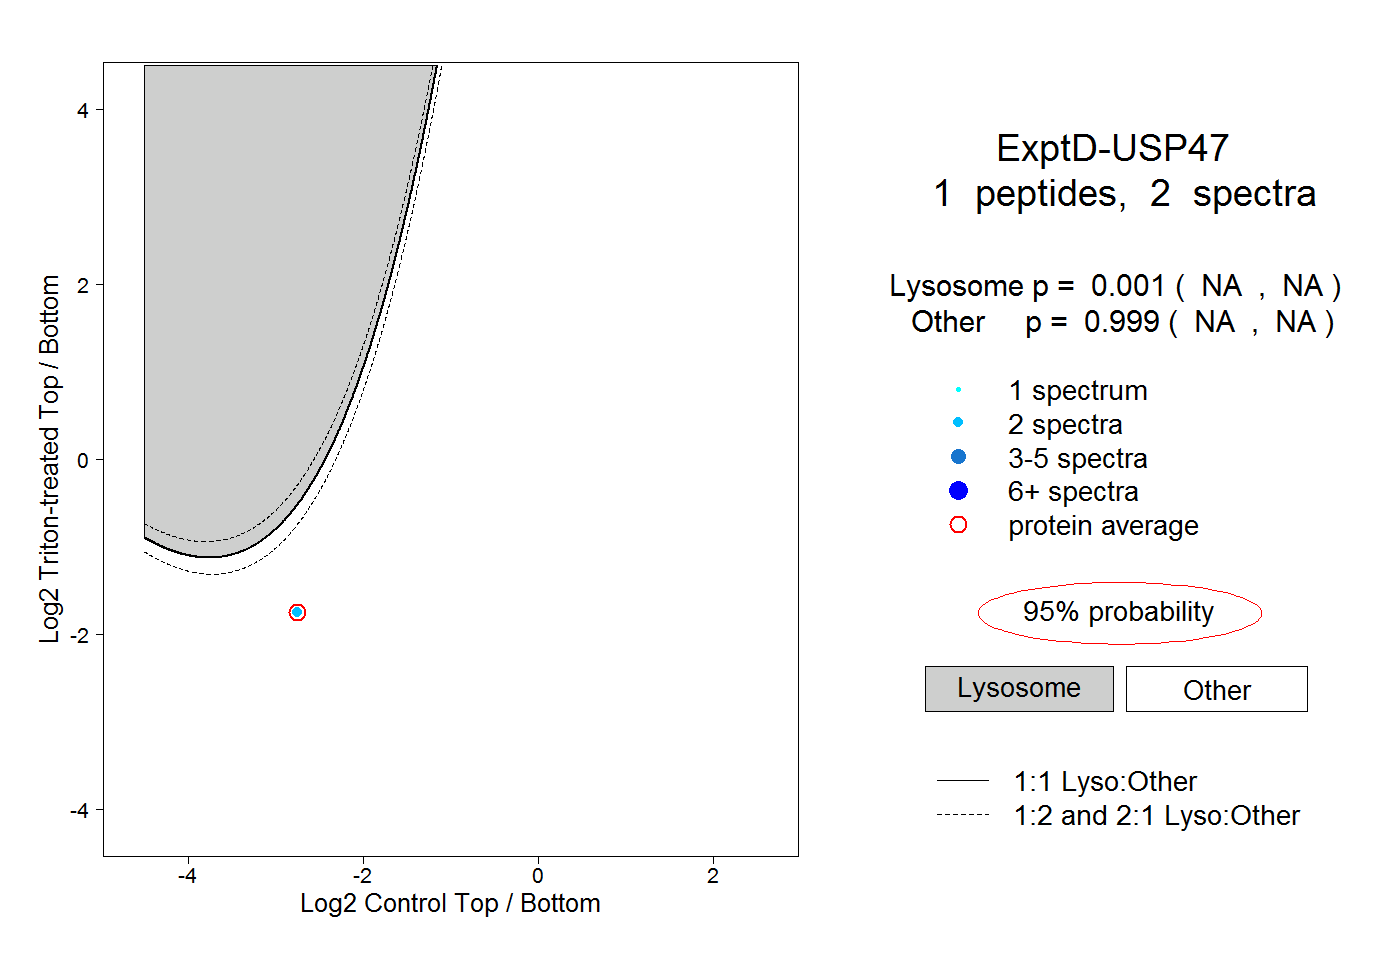 |
0.001 NA | NA |
0.999 NA | NA |