CD163
[ENSRNOP00000058828]
Main page
| | | Plot |
Mito |
Lyso |
|
Perox |
ER |
Golgi |
PM |
Cytosol |
Nucleus |
|
| Expt A |
 25
25
peptides |
66
spectra |
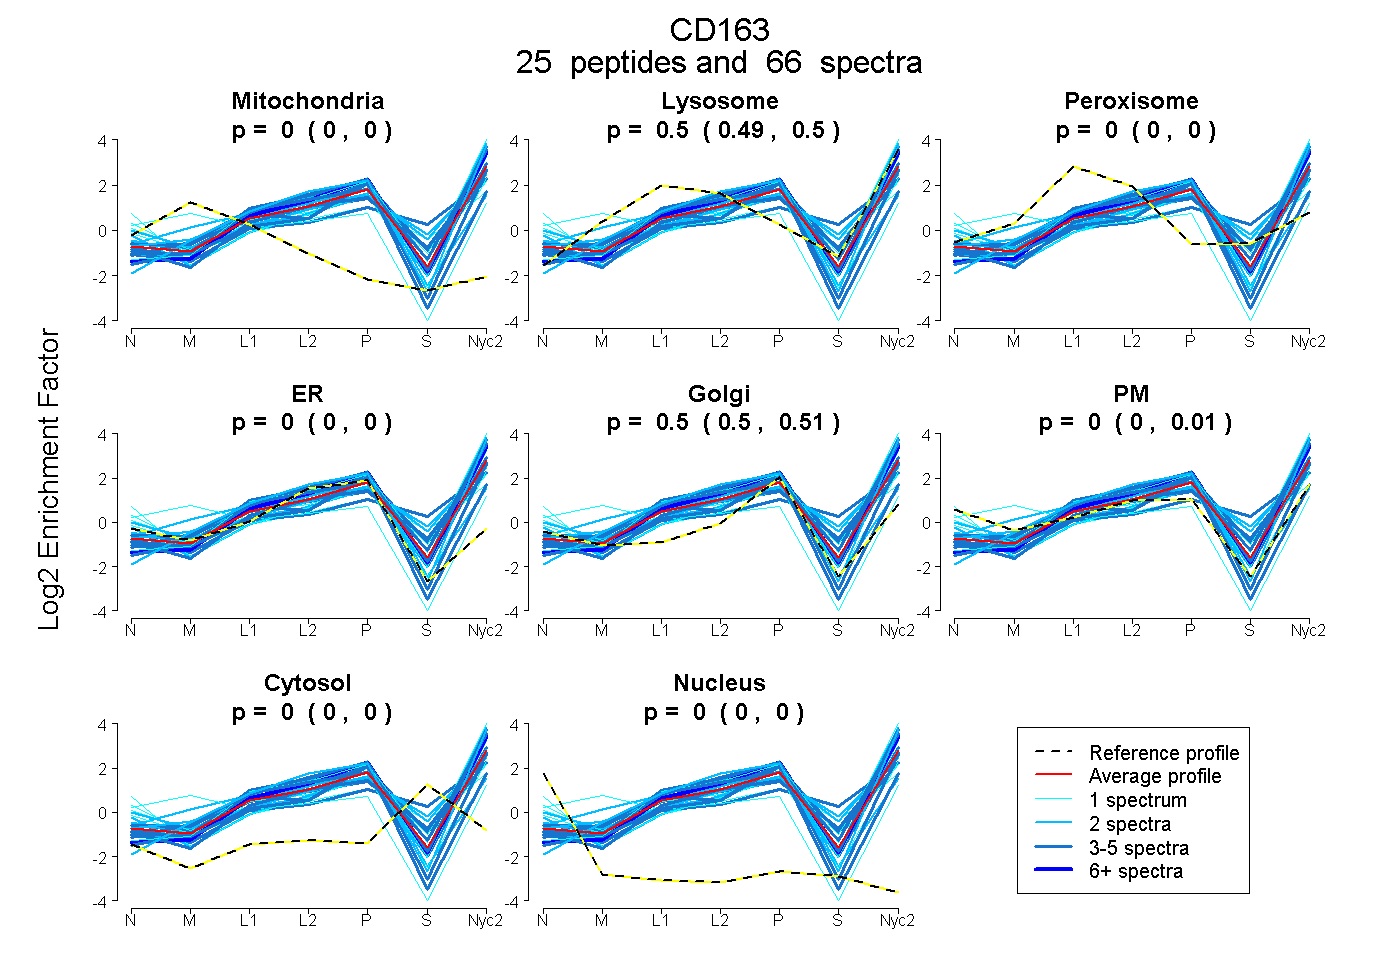 |
0.000
0.000 | 0.000 |
0.498
0.491 | 0.502 |
|
0.000
0.000 | 0.000 |
0.000
0.000 | 0.000 |
0.502
0.495 | 0.506 |
0.000
0.000 | 0.006 |
0.000
0.000 | 0.000 |
0.000
0.000 | 0.000 |
|
| | | Plot |
Mito |
|
Lyso or Perox |
|
ER |
Golgi |
PM |
Cytosol |
Nucleus |
|
| Expt B |
3
peptides |
4
spectra |
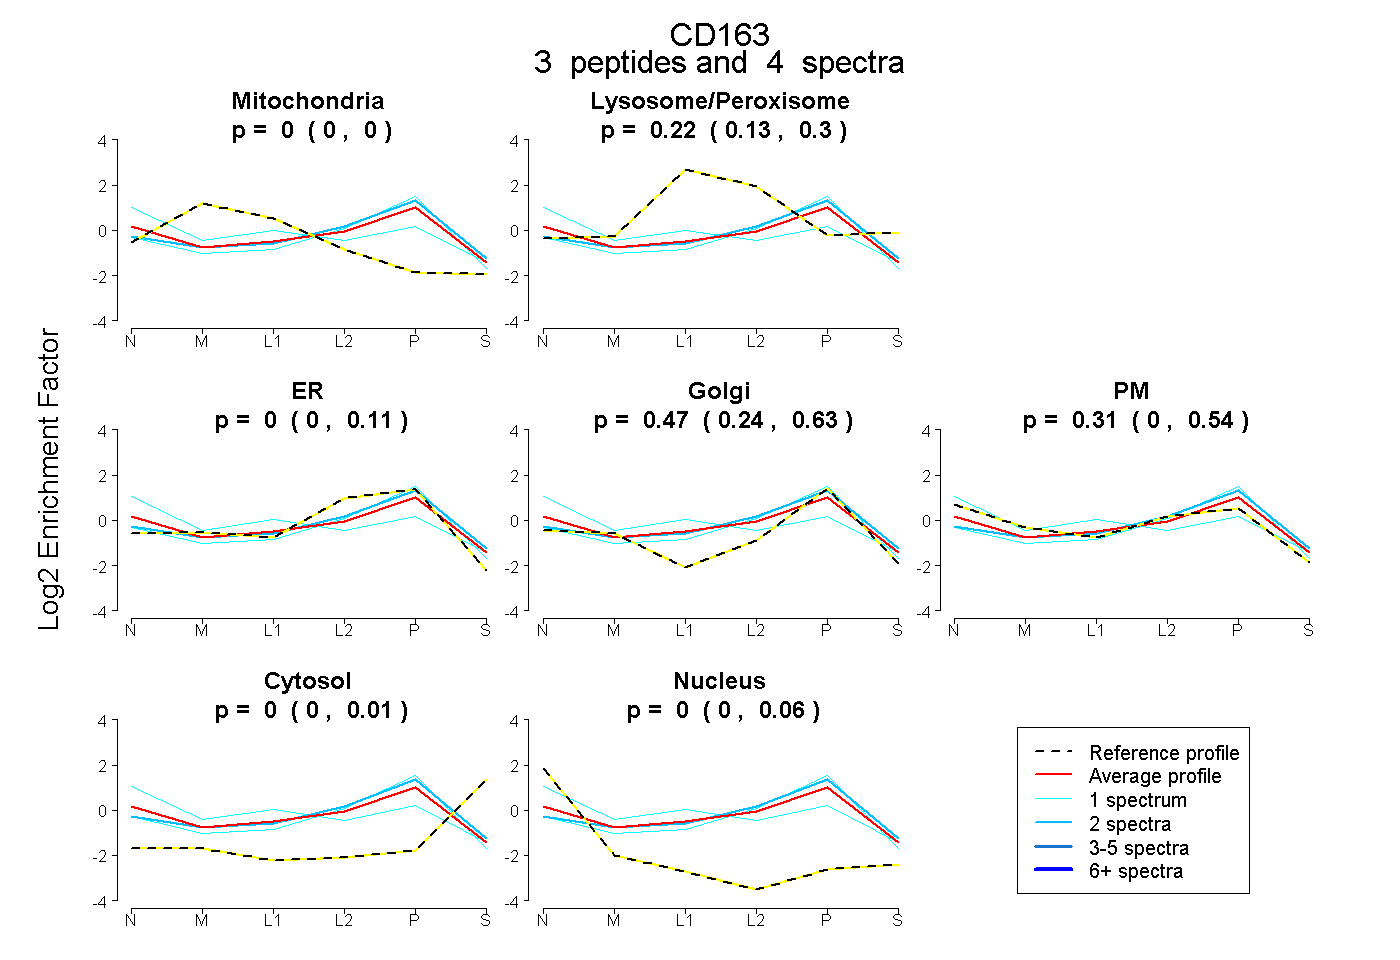 |
0.000
0.000 | 0.000 |
|
0.223
0.126 | 0.299 |
|
0.000
0.000 | 0.112 |
0.466
0.237 | 0.634 |
0.307
0.000 | 0.538 |
0.000
0.000 | 0.006 |
0.004
0.000 | 0.063 |
|
| 1 spectrum, LVGGEIPCSGR |
0.000 |
|
0.135 |
|
0.334 |
0.531 |
0.000 |
0.000 |
0.000 |
|
| 2 spectra, LVNSGDNR |
0.000 |
|
0.267 |
|
0.152 |
0.581 |
0.000 |
0.000 |
0.000 |
|
| 1 spectrum, LQEGHTDCSGR |
0.000 |
|
0.222 |
|
0.000 |
0.000 |
0.618 |
0.000 |
0.160 |
|
| | | Plot |
|
Lyso |
|
|
|
|
|
|
|
Other |
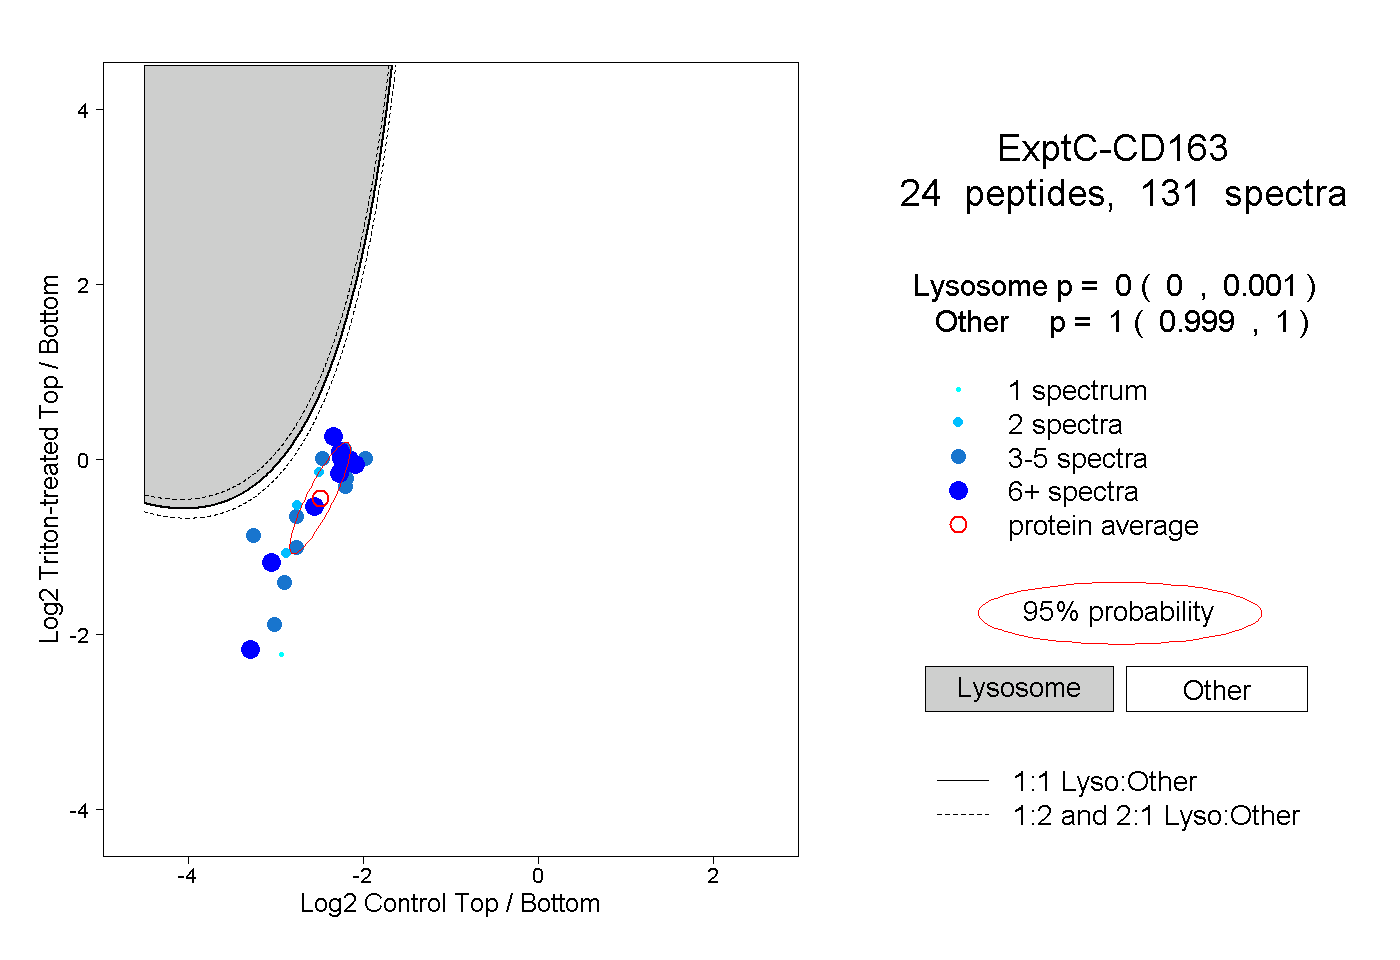
| Expt C |
24
peptides |
131
spectra |
 |
|
0.000
0.000 | 0.001 |
|
|
|
|
|
|
|
1.000
0.999 | 1.000 |
| | | Plot |
|
Lyso |
|
|
|
|
|
|
|
Other |
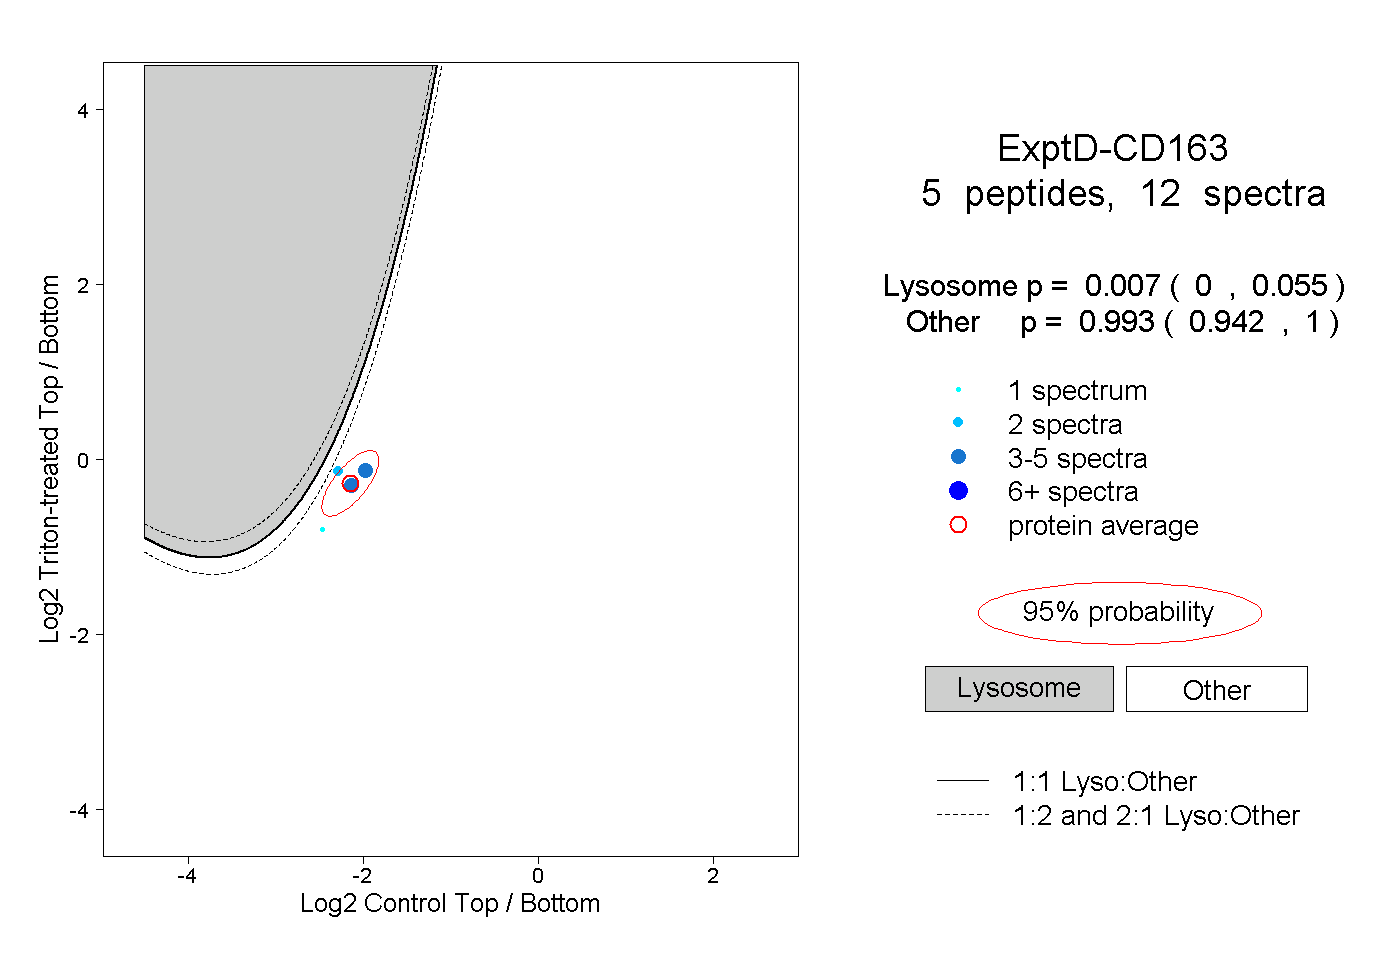
| Expt D |
5
peptides |
12
spectra |
 |
|
0.007
0.000 | 0.055 |
|
|
|
|
|
|
|
0.993
0.942 | 1.000 |