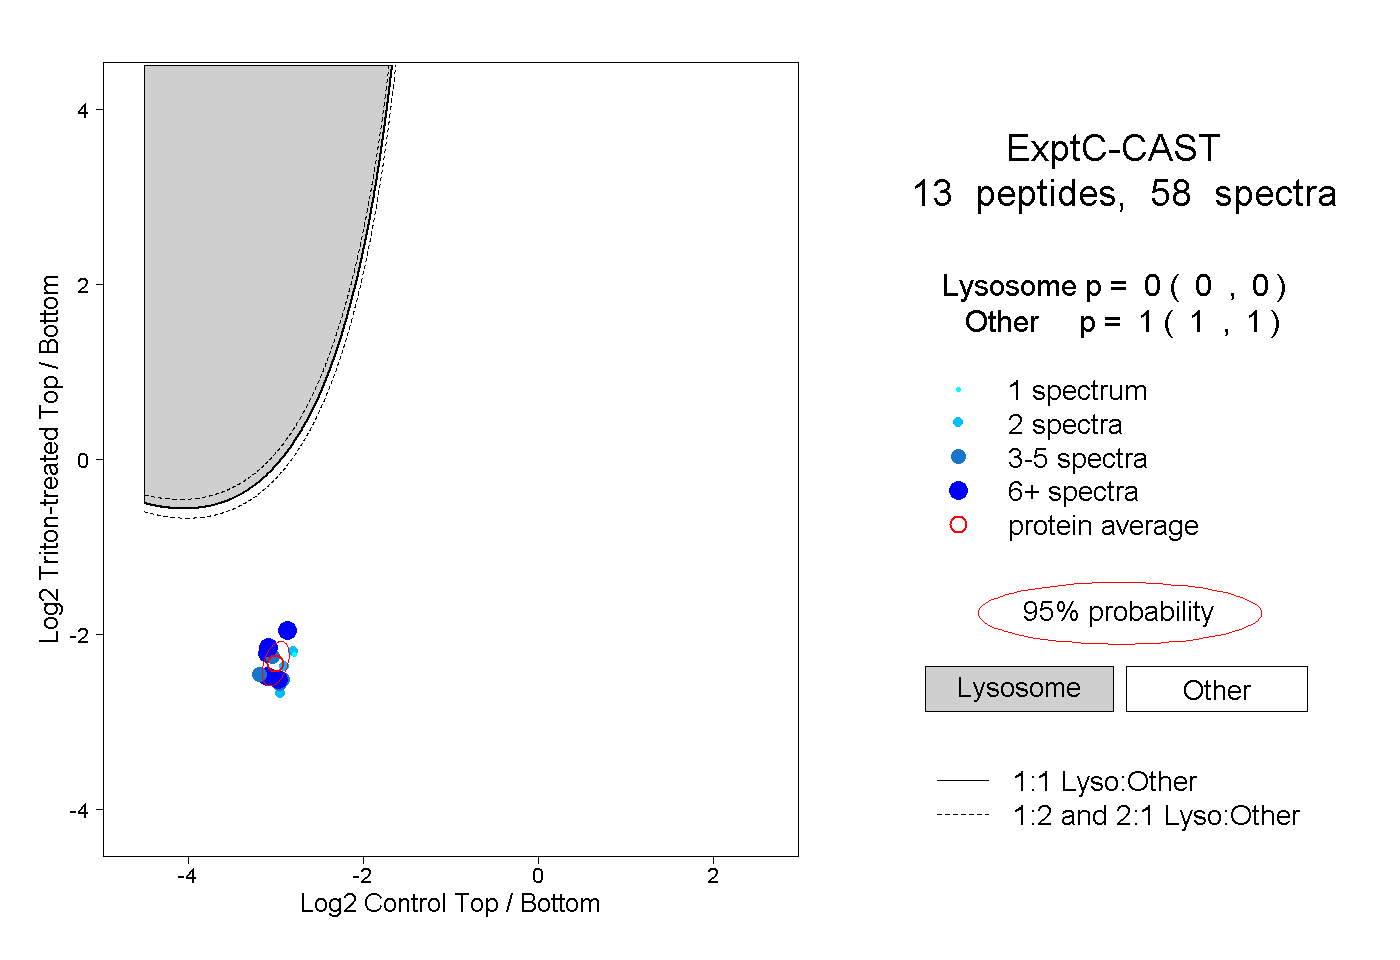
13
13peptides
spectra
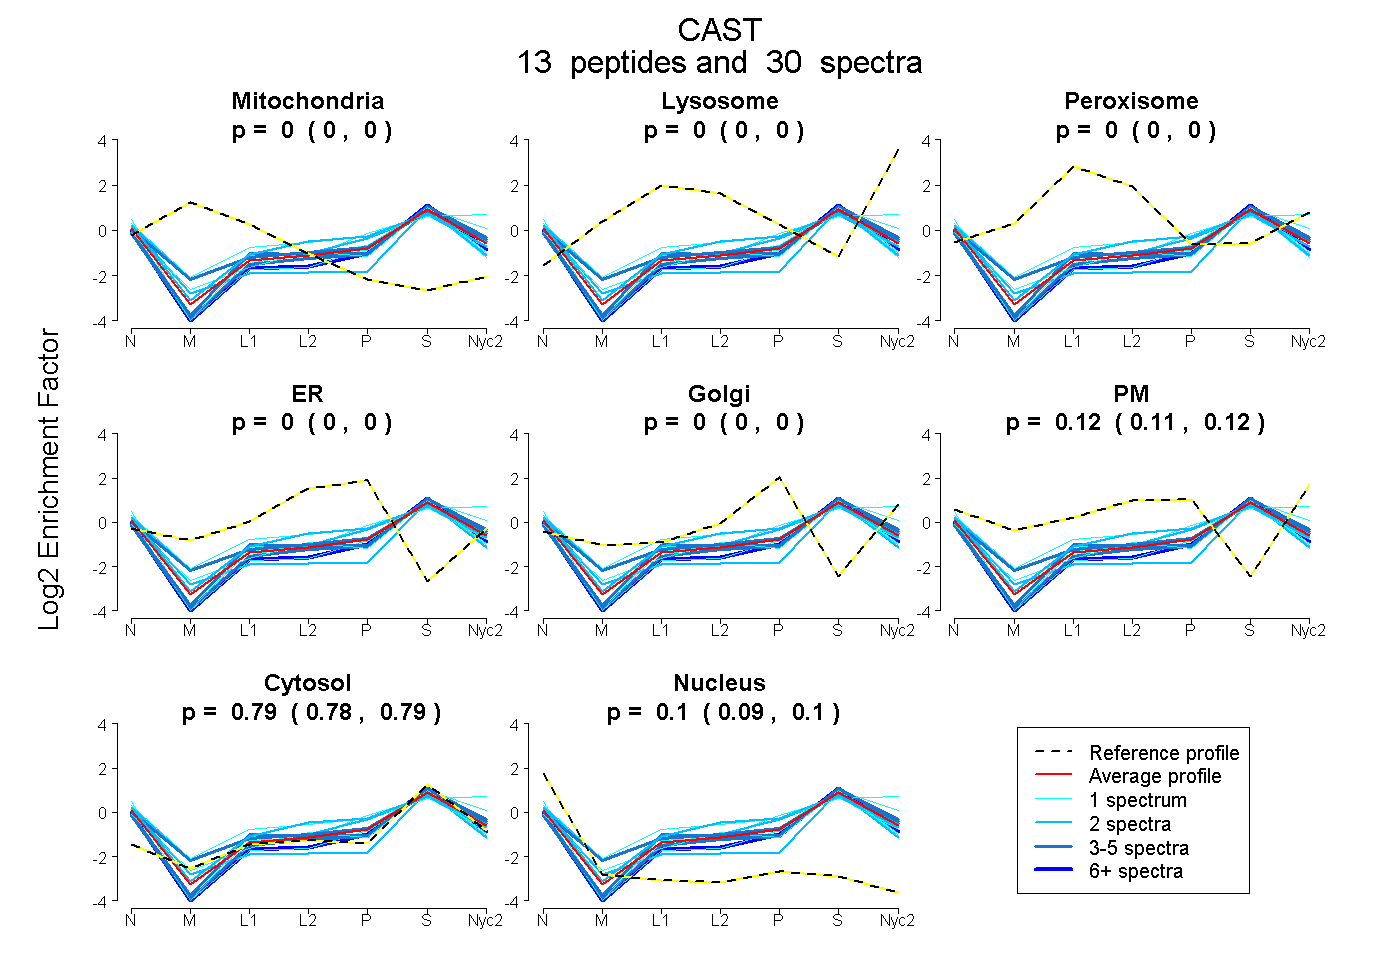
0.000 | 0.000
0.000 | 0.000
0.000 | 0.000
0.000 | 0.000
0.000 | 0.000
0.109 | 0.121
0.784 | 0.792
0.091 | 0.100
4peptides
spectra
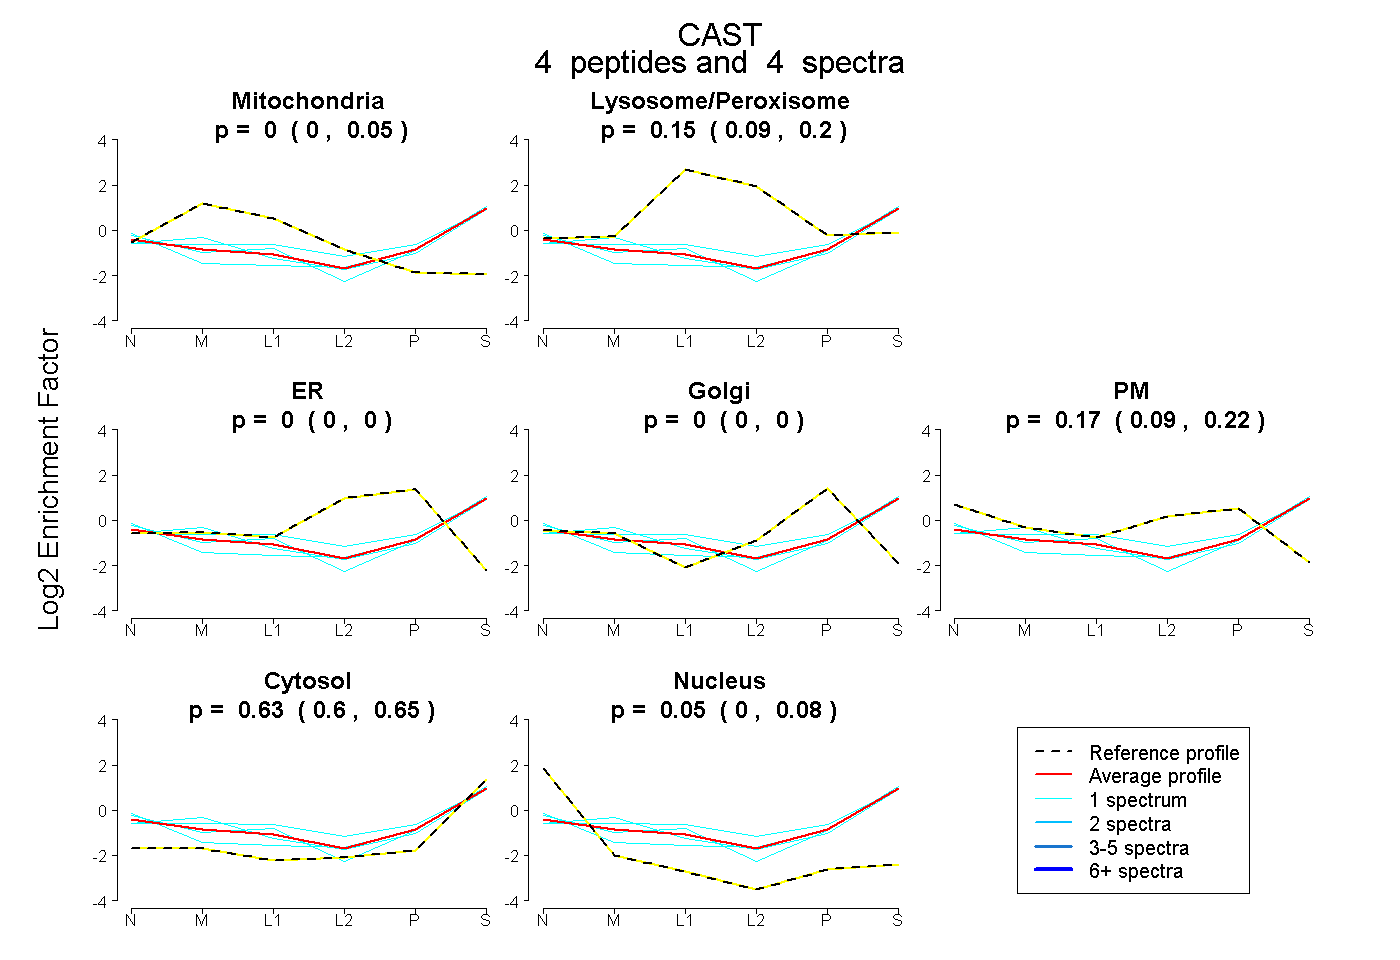
0.000 | 0.050
0.088 | 0.196
0.000 | 0.000
0.000 | 0.000
0.095 | 0.217
0.603 | 0.654
0.004 | 0.084