 13
13peptides
spectra
0.000 | 0.000
0.000 | 0.000
0.000 | 0.000
0.000 | 0.000
0.000 | 0.000
0.109 | 0.121
0.784 | 0.792
0.091 | 0.100
| Plot | Mito | Lyso | Perox | ER | Golgi | PM | Cytosol | Nucleus | |||||
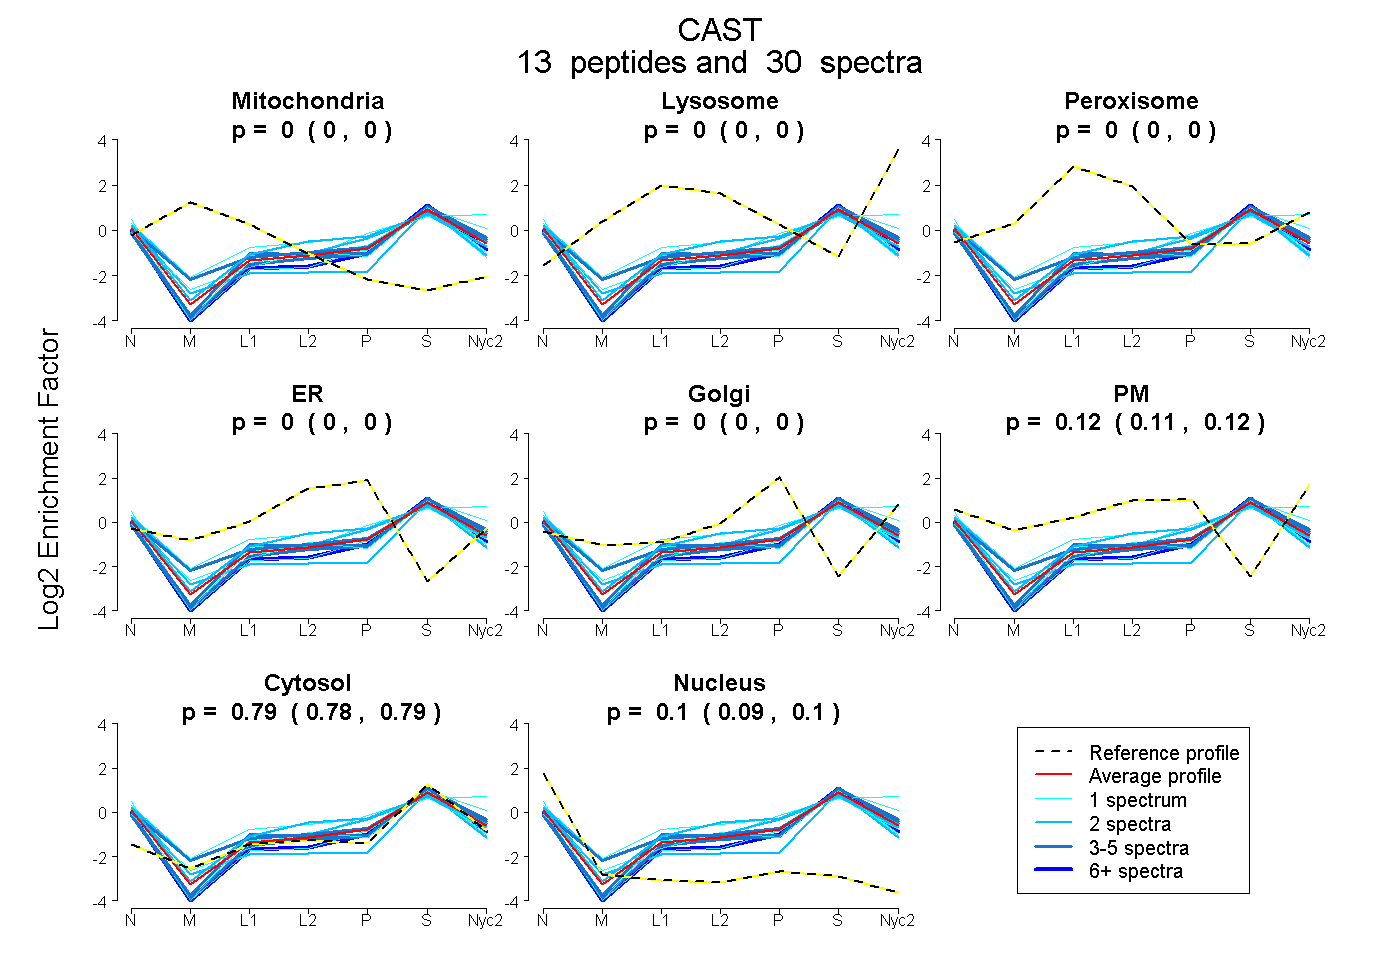
| Expt A |
13 peptides |
30 spectra |
|
0.000 0.000 | 0.000 |
0.000 0.000 | 0.000 |
0.000 0.000 | 0.000 |
0.000 0.000 | 0.000 |
0.000 0.000 | 0.000 |
0.115 0.109 | 0.121 |
0.789 0.784 | 0.792 |
0.096 0.091 | 0.100 |
| 4 spectra, GVVPDDAVETLAR | 0.000 | 0.000 | 0.000 | 0.000 | 0.000 | 0.092 | 0.861 | 0.047 | ||
| 1 spectrum, EGSETK | 0.000 | 0.000 | 0.000 | 0.000 | 0.008 | 0.000 | 0.838 | 0.154 | ||
| 1 spectrum, SNEQIVSEK | 0.000 | 0.000 | 0.000 | 0.000 | 0.000 | 0.379 | 0.621 | 0.000 | ||
| 1 spectrum, EGSEPQTLPK | 0.000 | 0.000 | 0.000 | 0.000 | 0.177 | 0.000 | 0.693 | 0.130 | ||
| 3 spectra, EGTIPPEYR | 0.000 | 0.000 | 0.000 | 0.000 | 0.000 | 0.041 | 0.878 | 0.081 | ||
| 2 spectra, MSTTGAK | 0.000 | 0.000 | 0.000 | 0.000 | 0.009 | 0.216 | 0.685 | 0.089 | ||
| 3 spectra, SLTPTLPMESTLNK | 0.000 | 0.000 | 0.000 | 0.000 | 0.000 | 0.199 | 0.735 | 0.065 | ||
| 1 spectrum, GSDEVTASSAATGTSPR | 0.000 | 0.000 | 0.000 | 0.000 | 0.000 | 0.136 | 0.834 | 0.030 | ||
| 1 spectrum, CGEDEDTVPAEYR | 0.000 | 0.000 | 0.000 | 0.048 | 0.000 | 0.000 | 0.804 | 0.147 | ||
| 2 spectra, SQSSEPPVIHEK | 0.000 | 0.000 | 0.000 | 0.083 | 0.000 | 0.150 | 0.721 | 0.046 | ||
| 1 spectrum, QPDPDENKPLDDK | 0.000 | 0.000 | 0.000 | 0.000 | 0.000 | 0.087 | 0.806 | 0.107 | ||
| 2 spectra, DDTIPPEYR | 0.000 | 0.000 | 0.000 | 0.000 | 0.000 | 0.000 | 0.776 | 0.224 | ||
| 8 spectra, AQSAGVTR | 0.000 | 0.000 | 0.000 | 0.000 | 0.000 | 0.000 | 0.862 | 0.138 |
| Plot | Mito | Lyso or Perox | ER | Golgi | PM | Cytosol | Nucleus | ||||||
| Expt B |
4 peptides |
4 spectra |
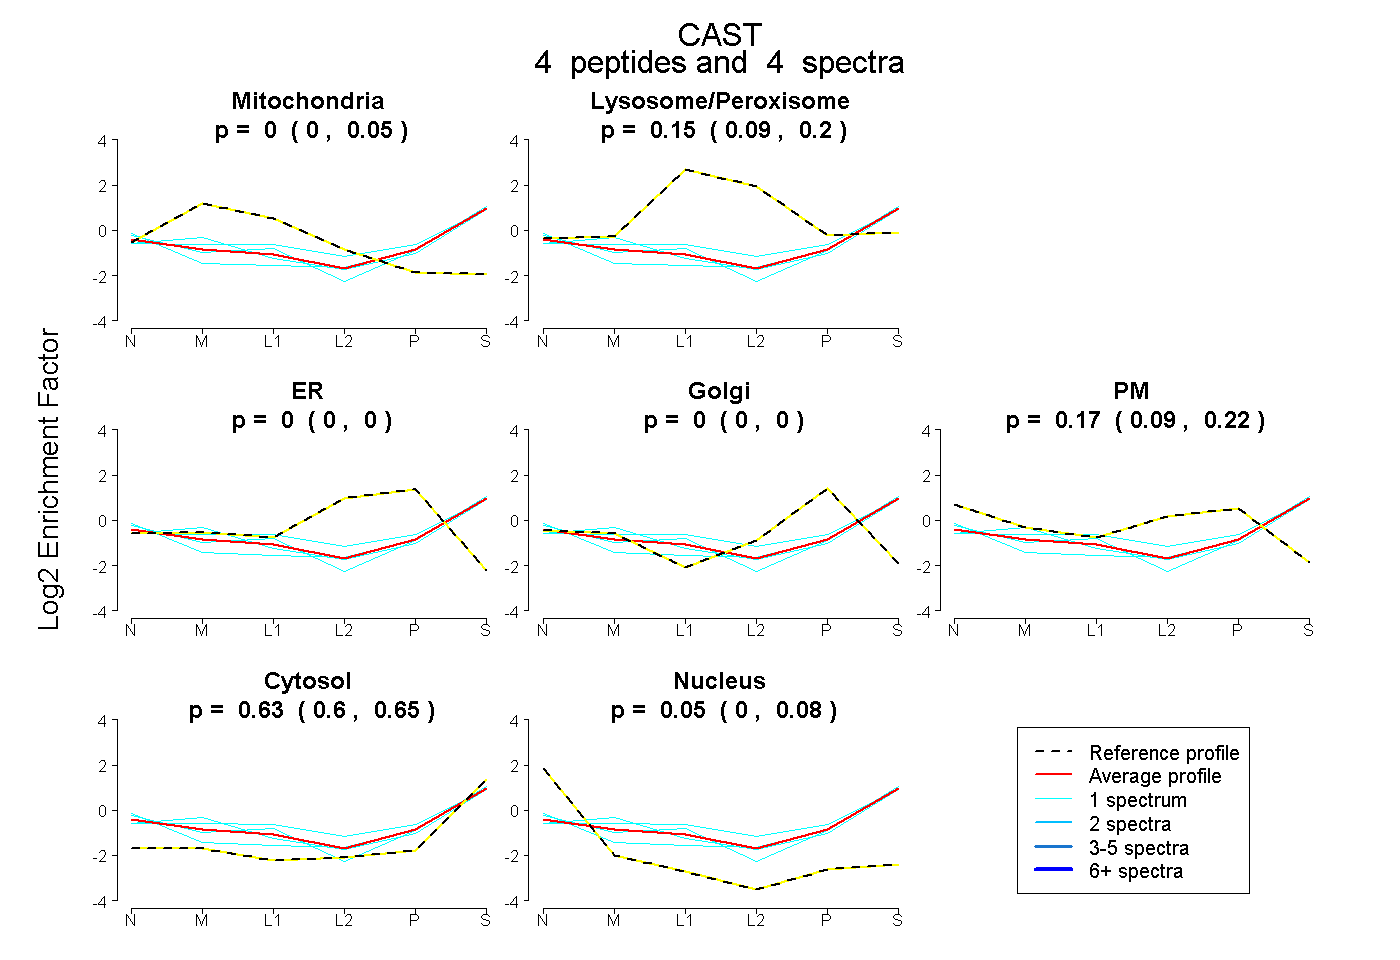 |
0.000 0.000 | 0.050 |
0.151 0.088 | 0.196 |
0.000 0.000 | 0.000 |
0.000 0.000 | 0.000 |
0.166 0.095 | 0.217 |
0.631 0.603 | 0.654 |
0.053 0.004 | 0.084 |
|||
| Plot | Lyso | Other | |||||||||||
| Expt C |
13 peptides |
58 spectra |
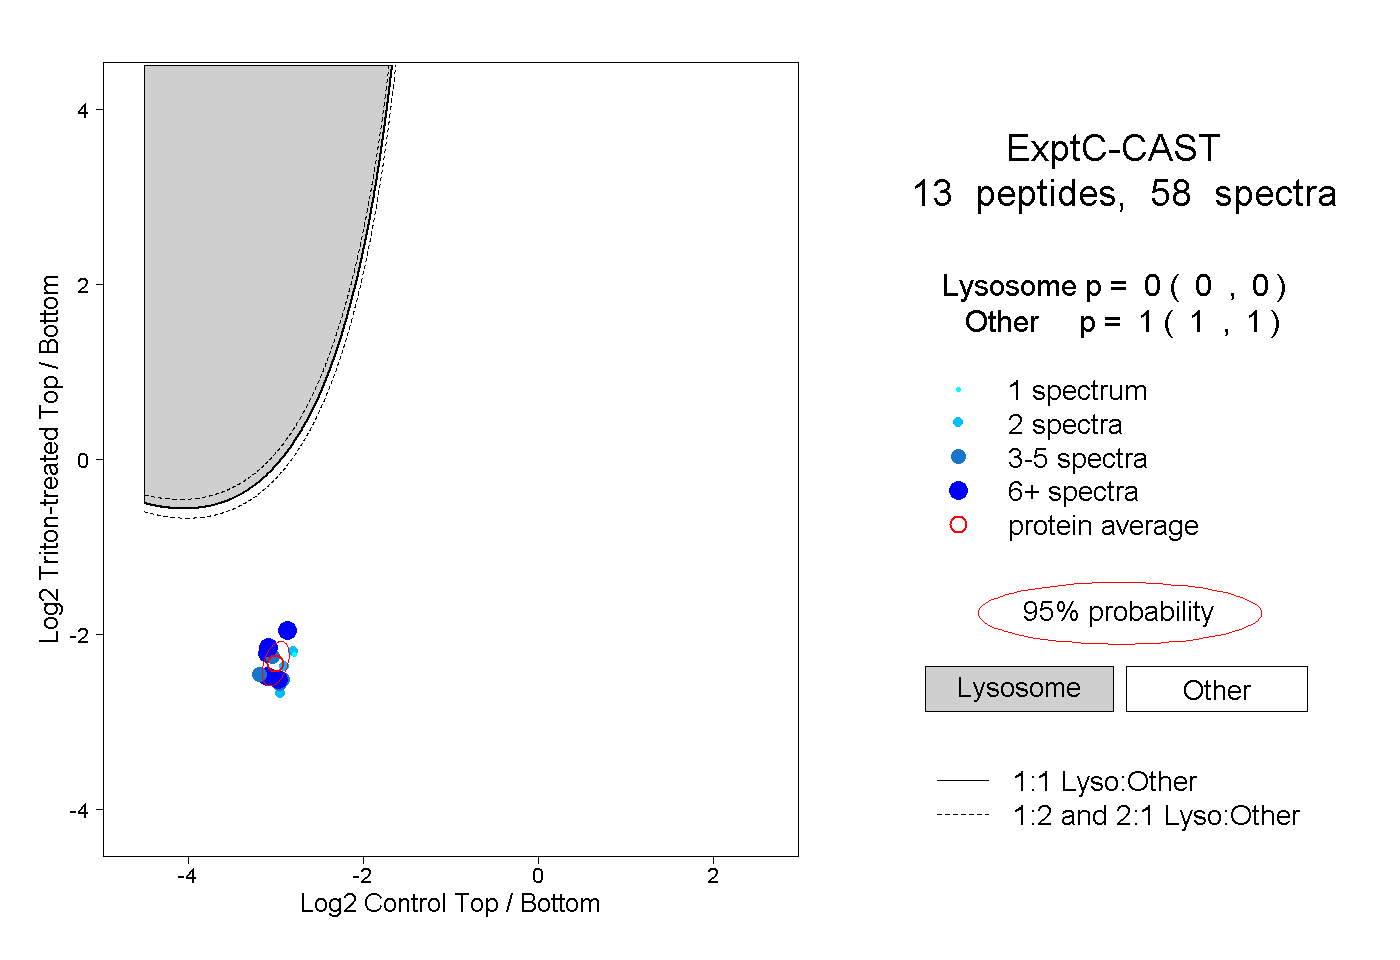 |
0.000 0.000 | 0.000 |
1.000 1.000 | 1.000 |
||||||||
| Plot | Lyso | Other | |||||||||||
| Expt D |
1 peptide |
1 spectrum |
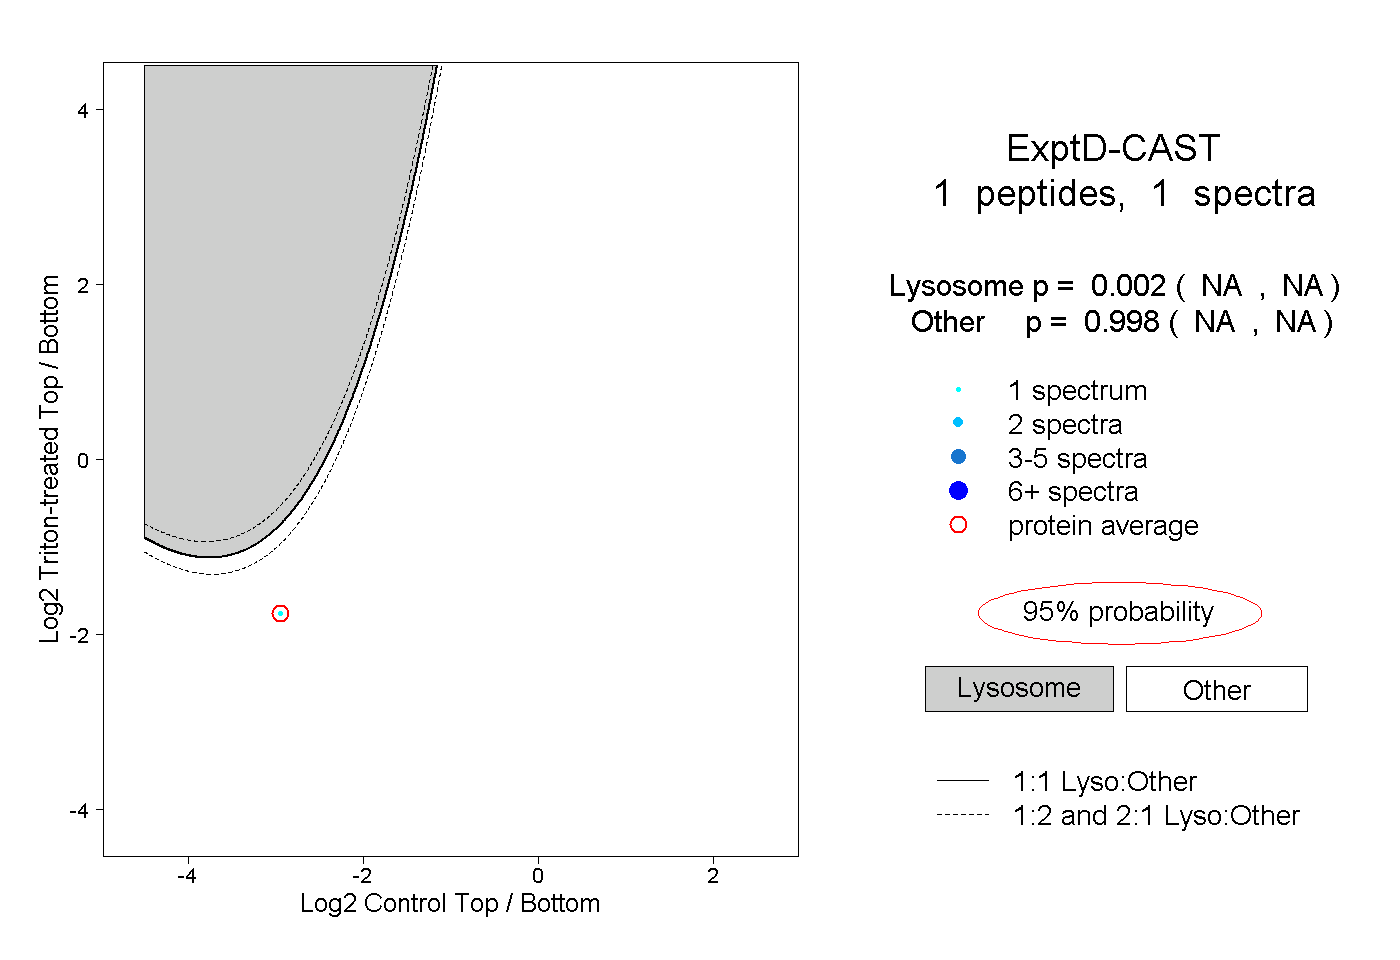 |
0.002 NA | NA |
0.998 NA | NA |