 5
5peptides
spectra
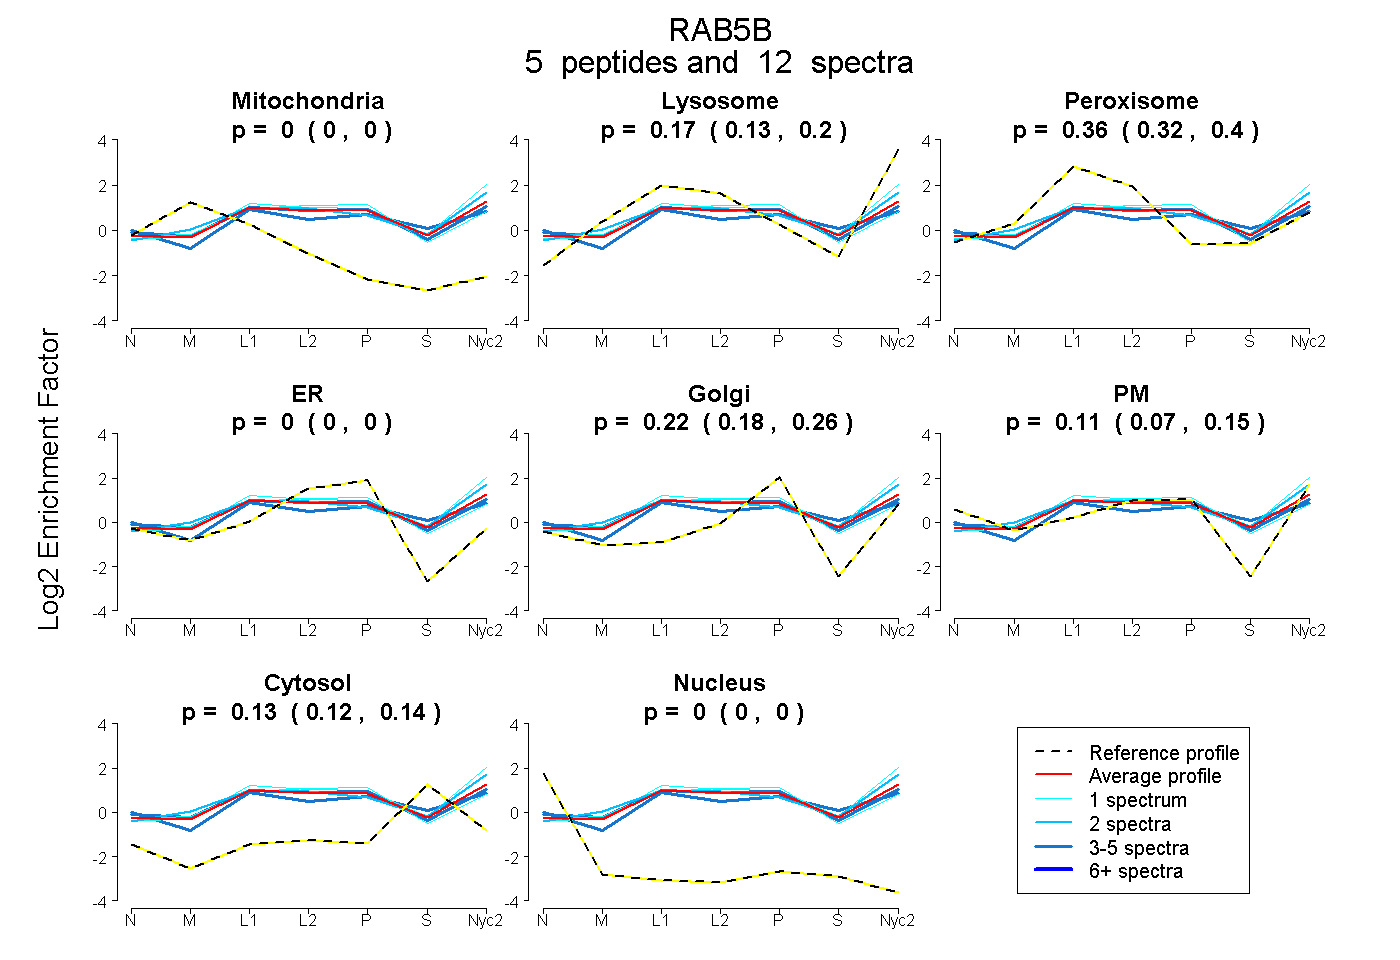
0.000 | 0.000
0.129 | 0.204
0.315 | 0.397
0.000 | 0.000
0.182 | 0.264
0.065 | 0.154
0.120 | 0.143
0.000 | 0.000
8peptides
spectra

0.000 | 0.000
0.474 | 0.489
0.000 | 0.000
0.265 | 0.288
0.000 | 0.000
0.231 | 0.250
0.000 | 0.000
5peptides
spectra
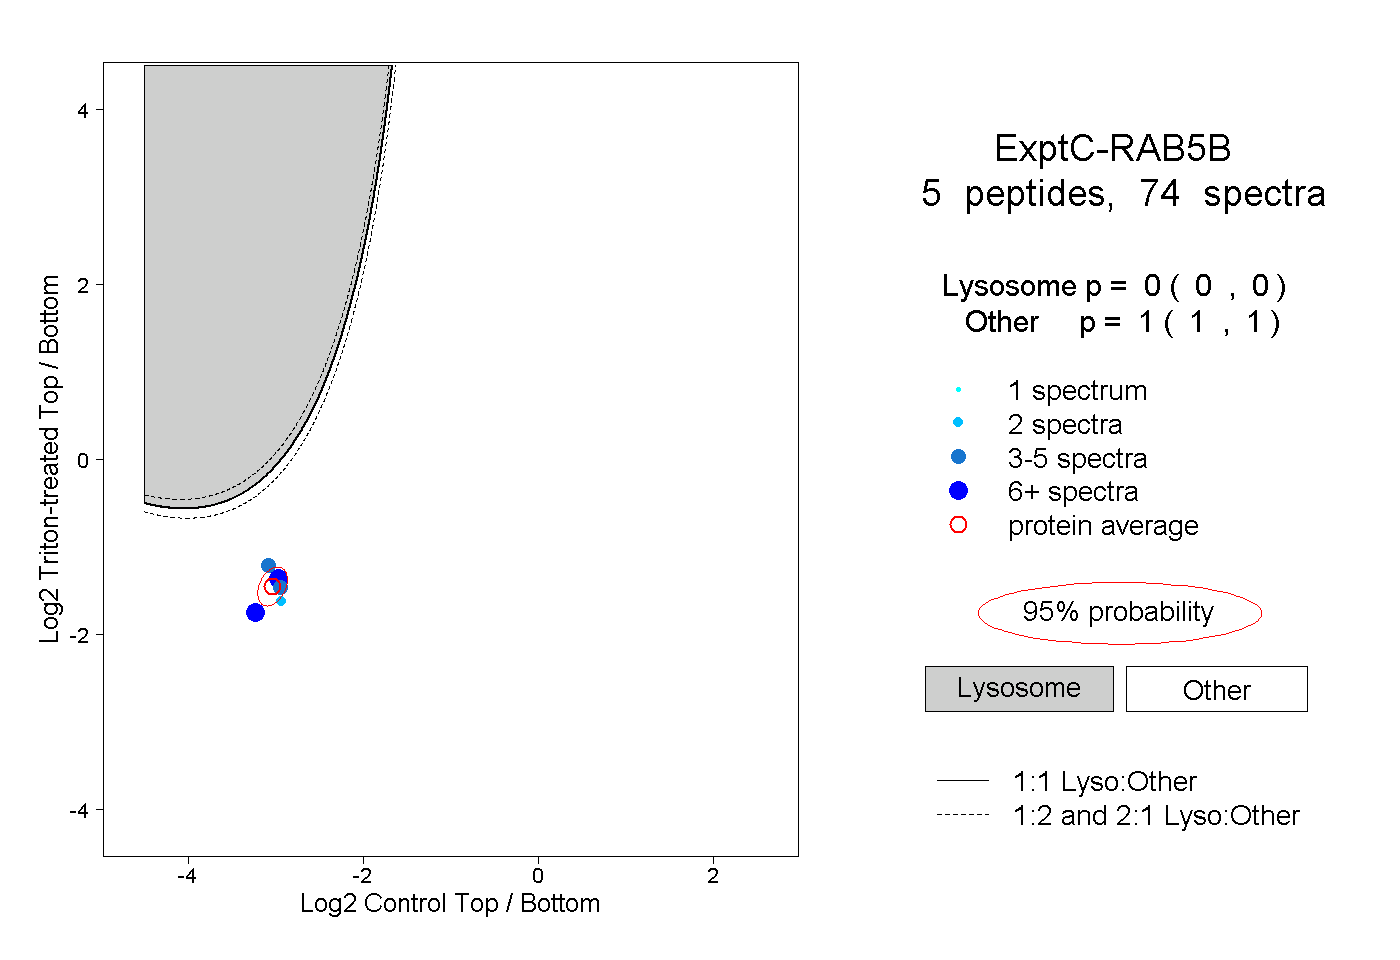
0.000 | 0.000
1.000 | 1.000
