 5
5peptides
spectra
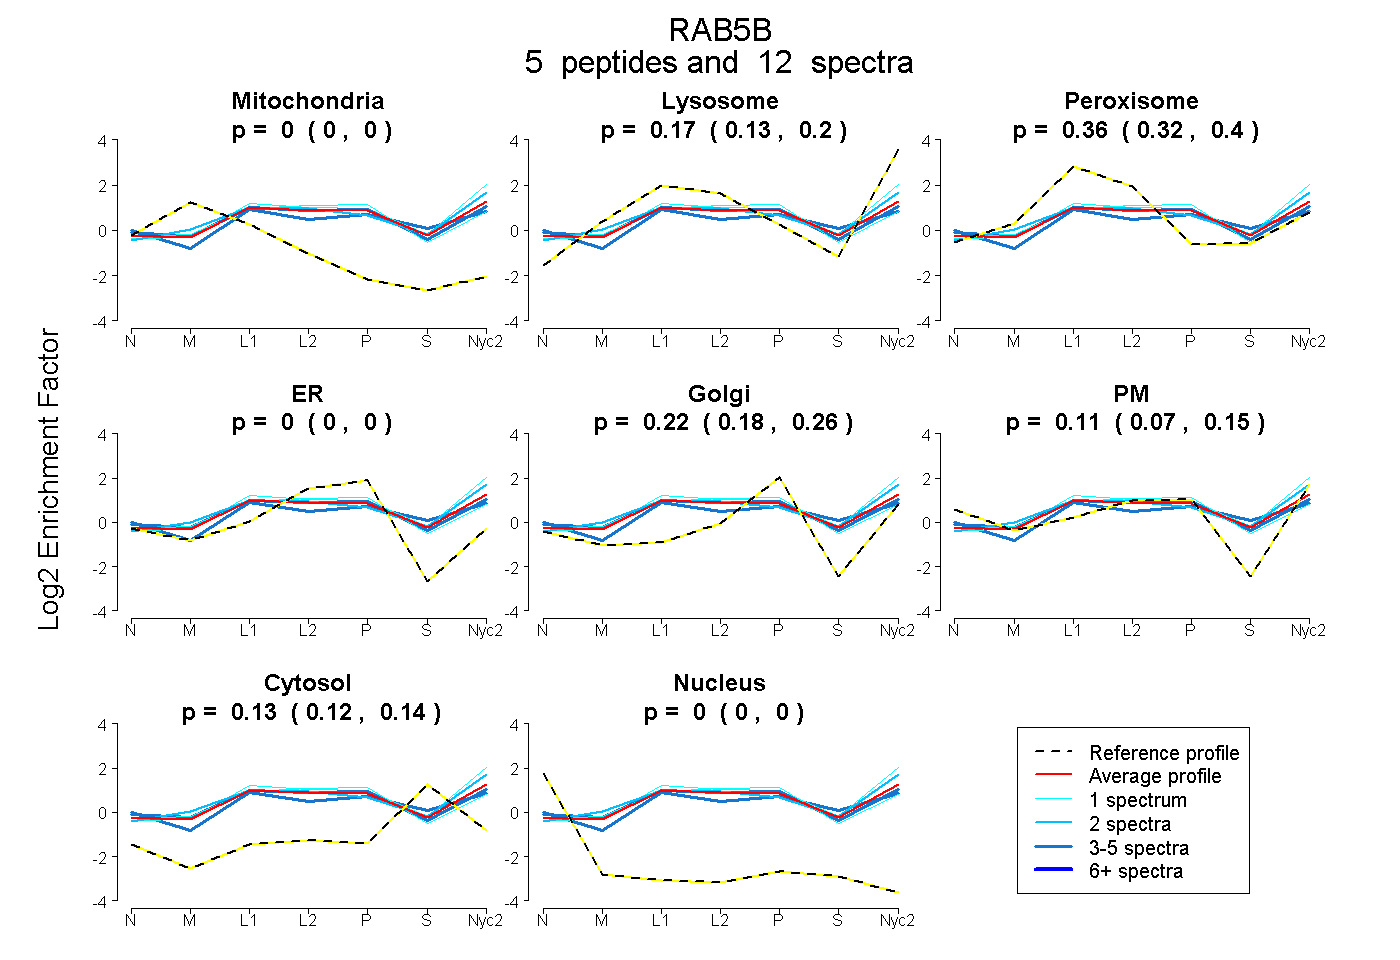
0.000 | 0.000
0.129 | 0.204
0.315 | 0.397
0.000 | 0.000
0.182 | 0.264
0.065 | 0.154
0.120 | 0.143
0.000 | 0.000
| Plot | Mito | Lyso | Perox | ER | Golgi | PM | Cytosol | Nucleus | |||||
| Expt A |
5 peptides |
12 spectra |
|
0.000 0.000 | 0.000 |
0.168 0.129 | 0.204 |
0.360 0.315 | 0.397 |
0.000 0.000 | 0.000 |
0.225 0.182 | 0.264 |
0.114 0.065 | 0.154 |
0.133 0.120 | 0.143 |
0.000 0.000 | 0.000 |
| 1 spectrum, QASPSIVIALAGNK | 0.000 | 0.402 | 0.196 | 0.000 | 0.127 | 0.154 | 0.121 | 0.000 | ||
| 2 spectra, TAMNVNDLFLAIAK | 0.000 | 0.336 | 0.253 | 0.000 | 0.104 | 0.155 | 0.152 | 0.000 | ||
| 5 spectra, SEPQNPGGAAGR | 0.000 | 0.069 | 0.443 | 0.000 | 0.298 | 0.095 | 0.095 | 0.000 | ||
| 3 spectra, GVDLHEQAQQNK | 0.000 | 0.024 | 0.389 | 0.000 | 0.174 | 0.176 | 0.238 | 0.000 | ||
| 1 spectrum, STARPNGQPQASK | 0.000 | 0.014 | 0.518 | 0.000 | 0.428 | 0.000 | 0.040 | 0.000 |
| Plot | Mito | Lyso or Perox | ER | Golgi | PM | Cytosol | Nucleus | ||||||
| Expt B |
8 peptides |
18 spectra |
 |
0.000 0.000 | 0.000 |
0.482 0.474 | 0.489 |
0.000 0.000 | 0.000 |
0.277 0.265 | 0.288 |
0.000 0.000 | 0.000 |
0.241 0.231 | 0.250 |
0.000 0.000 | 0.000 |
|||
| Plot | Lyso | Other | |||||||||||
| Expt C |
5 peptides |
74 spectra |
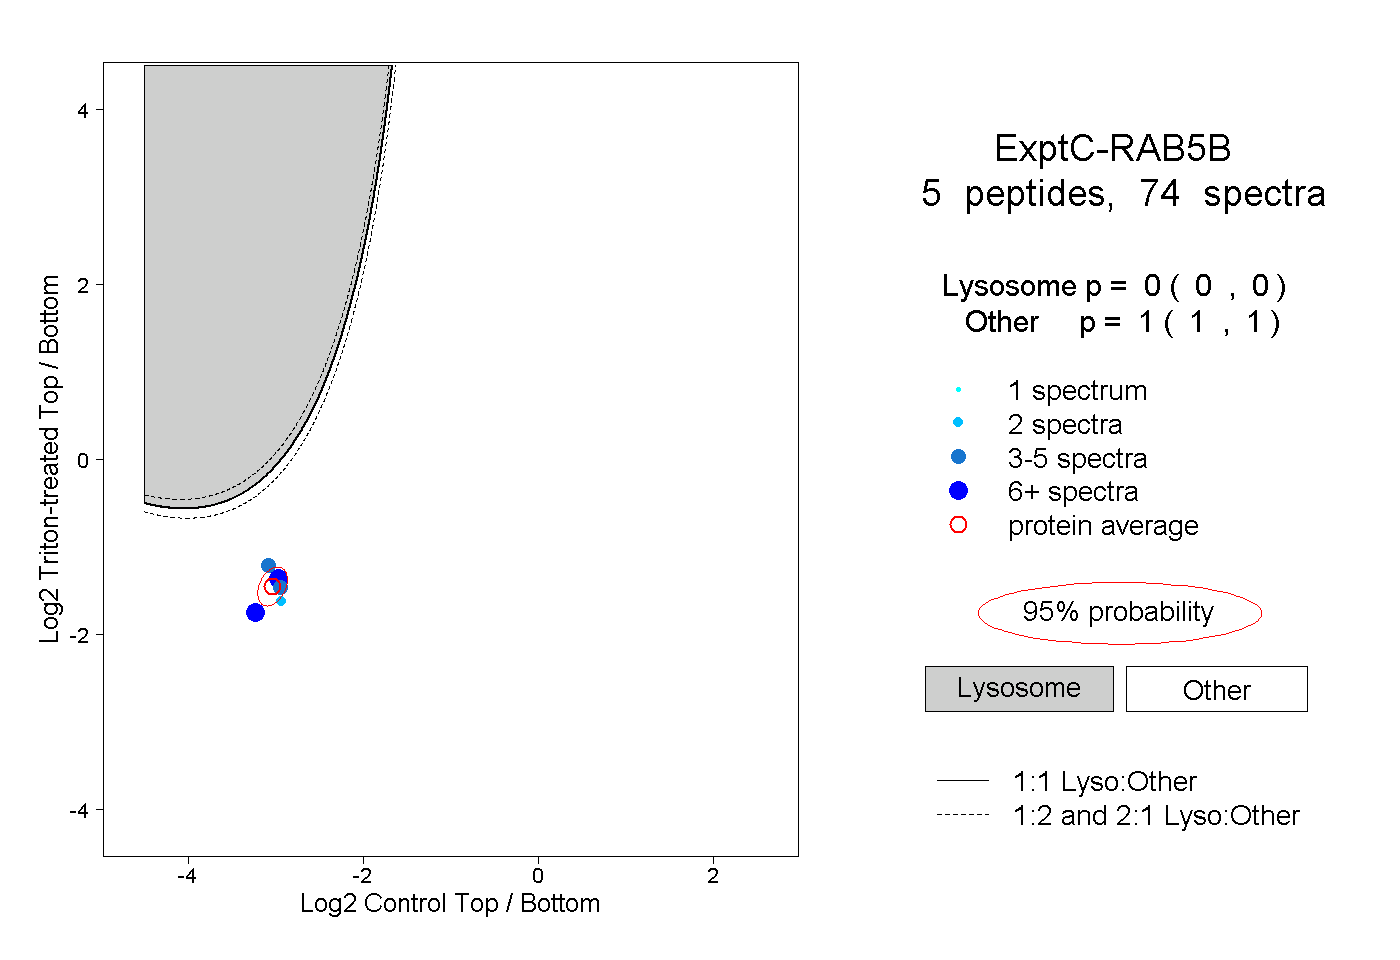 |
0.000 0.000 | 0.000 |
1.000 1.000 | 1.000 |
||||||||
| Plot | Lyso | Other | |||||||||||
| Expt D |
3 peptides |
9 spectra |
 |
0.001 0.000 | 0.001 |
0.999 0.999 | 1.000 |