 7
7peptides
spectra
0.000 | 0.000
0.000 | 0.000
0.000 | 0.000
0.000 | 0.000
0.000 | 0.014
0.000 | 0.000
0.984 | 1.000
0.000 | 0.000
| Plot | Mito | Lyso | Perox | ER | Golgi | PM | Cytosol | Nucleus | |||||
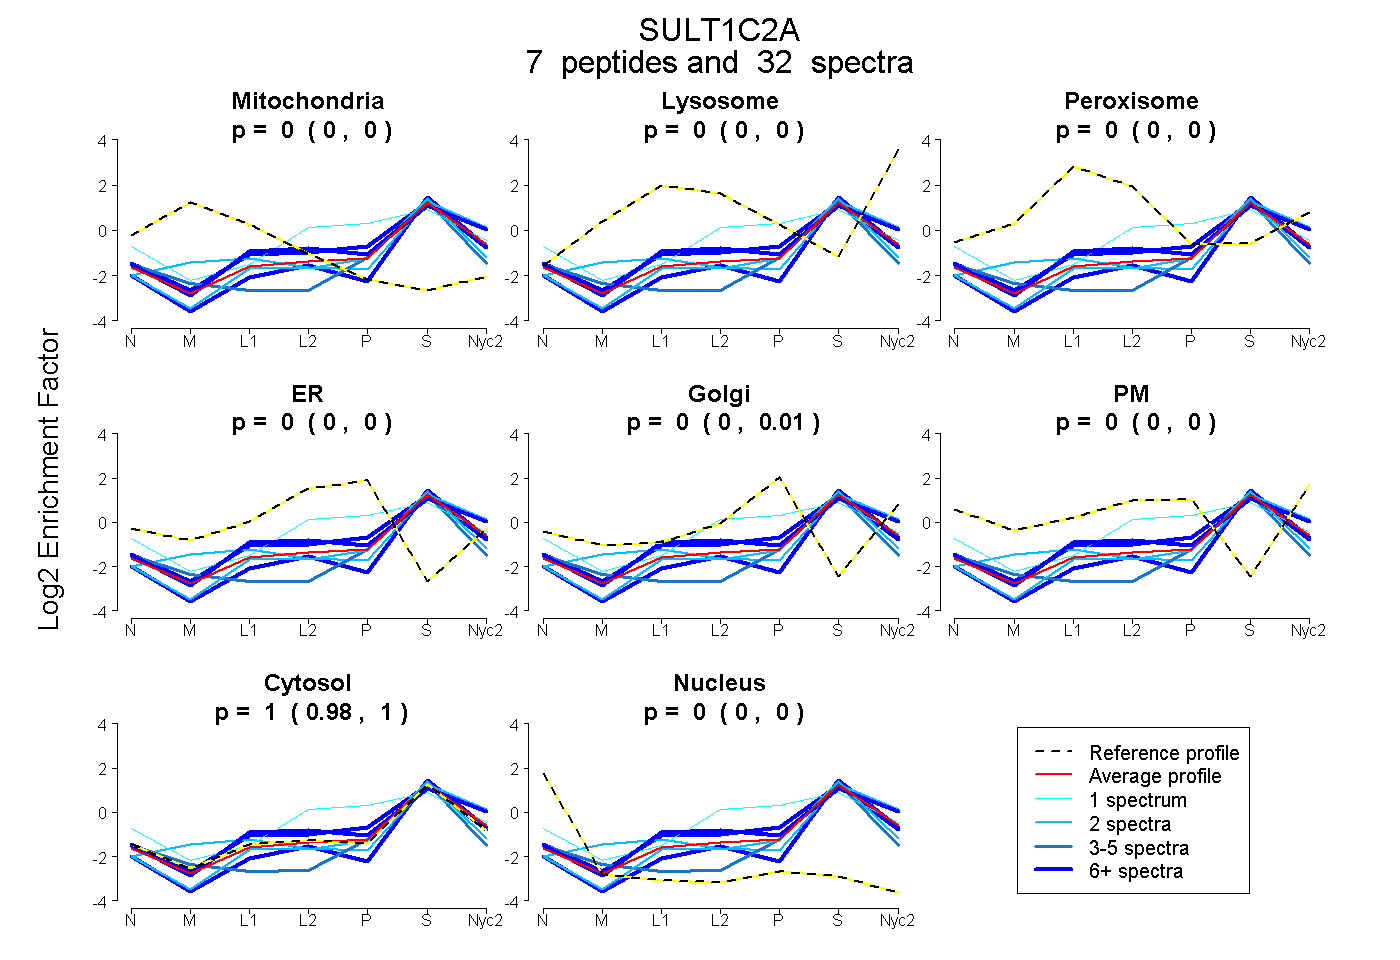
| Expt A |
7 peptides |
32 spectra |
|
0.000 0.000 | 0.000 |
0.000 0.000 | 0.000 |
0.000 0.000 | 0.000 |
0.000 0.000 | 0.000 |
0.004 0.000 | 0.014 |
0.000 0.000 | 0.000 |
0.996 0.984 | 1.000 |
0.000 0.000 | 0.000 |
| 2 spectra, SVLDQSISPFMR | 0.000 | 0.000 | 0.000 | 0.000 | 0.000 | 0.000 | 1.000 | 0.000 | ||
| 4 spectra, HPFIEWARPPQPSGVDK | 0.000 | 0.000 | 0.000 | 0.000 | 0.000 | 0.000 | 0.867 | 0.133 | ||
| 2 spectra, GWWEIR | 0.016 | 0.111 | 0.000 | 0.000 | 0.000 | 0.000 | 0.874 | 0.000 | ||
| 6 spectra, FLYVAR | 0.000 | 0.008 | 0.000 | 0.081 | 0.000 | 0.000 | 0.912 | 0.000 | ||
| 9 spectra, TLIQHR | 0.000 | 0.123 | 0.000 | 0.000 | 0.000 | 0.000 | 0.877 | 0.000 | ||
| 1 spectrum, HPVIEWARPPQPSGVDK | 0.000 | 0.000 | 0.000 | 0.288 | 0.019 | 0.000 | 0.693 | 0.000 | ||
| 8 spectra, FDEIYEQK | 0.000 | 0.000 | 0.000 | 0.000 | 0.000 | 0.000 | 1.000 | 0.000 |
| Plot | Mito | Lyso or Perox | ER | Golgi | PM | Cytosol | Nucleus | ||||||
| Expt B |
4 peptides |
10 spectra |
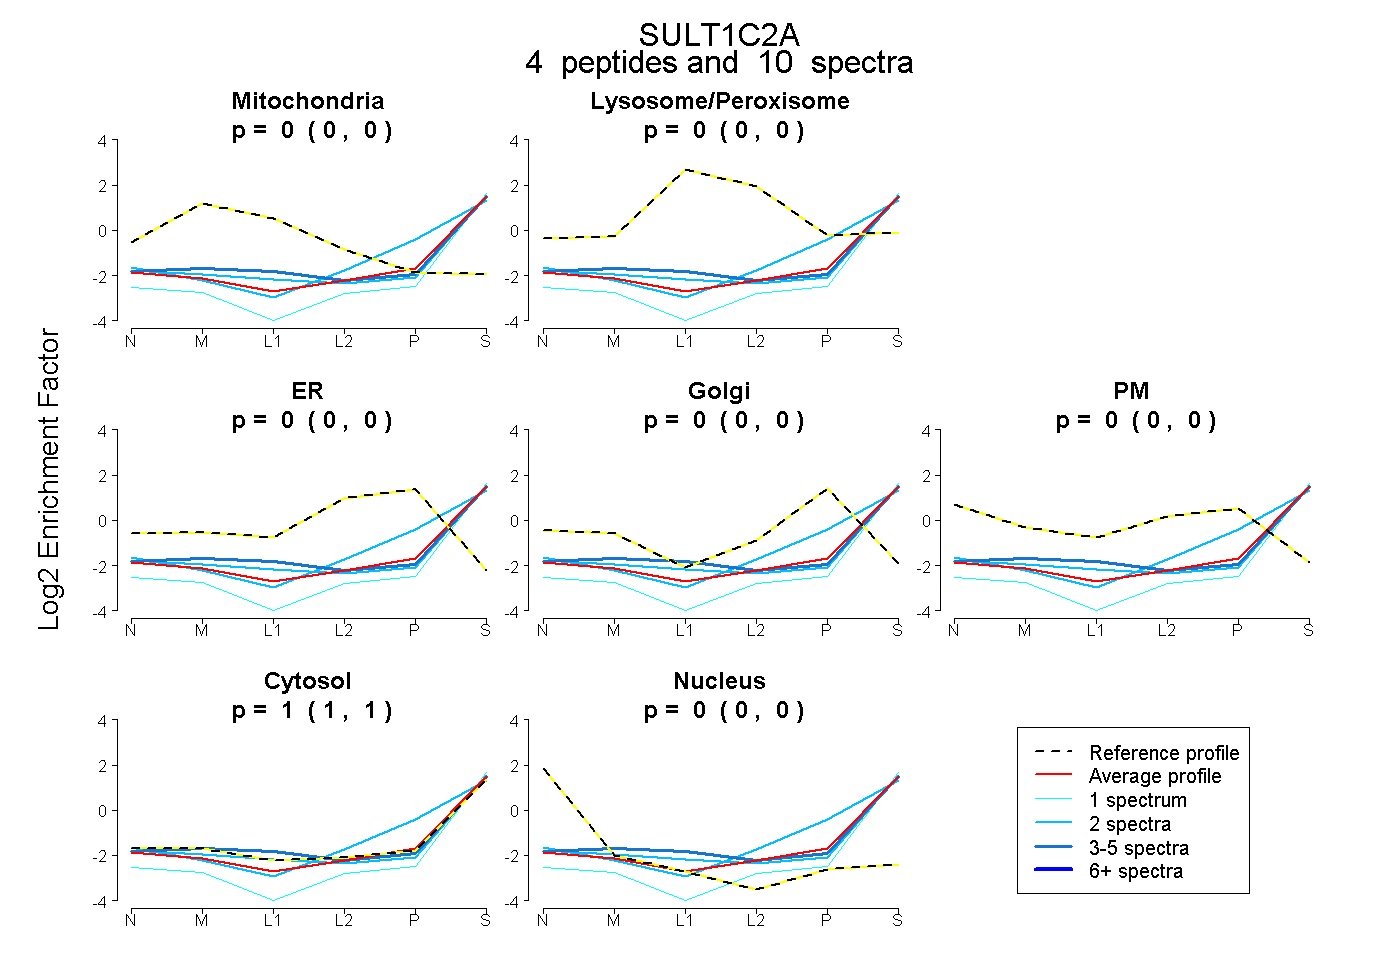 |
0.000 0.000 | 0.000 |
0.000 0.000 | 0.000 |
0.000 0.000 | 0.000 |
0.000 0.000 | 0.000 |
0.000 0.000 | 0.000 |
1.000 0.998 | 1.000 |
0.000 0.000 | 0.000 |
|||
| Plot | Lyso | Other | |||||||||||
| Expt C |
4 peptides |
9 spectra |
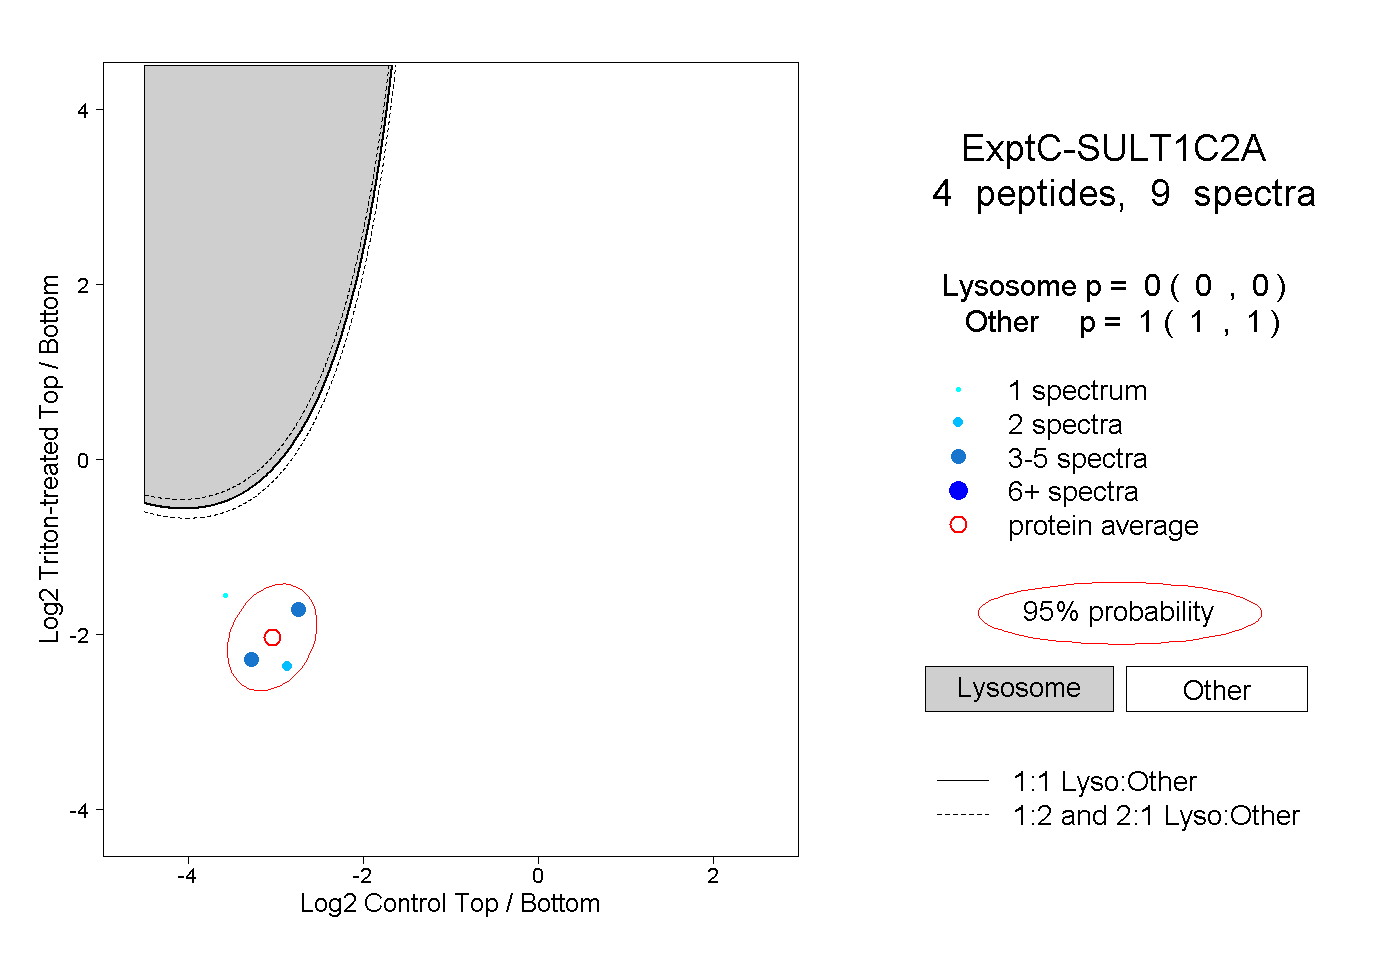 |
0.000 0.000 | 0.000 |
1.000 1.000 | 1.000 |
||||||||
| Plot | Lyso | Other | |||||||||||
| Expt D |
1 peptide |
1 spectrum |
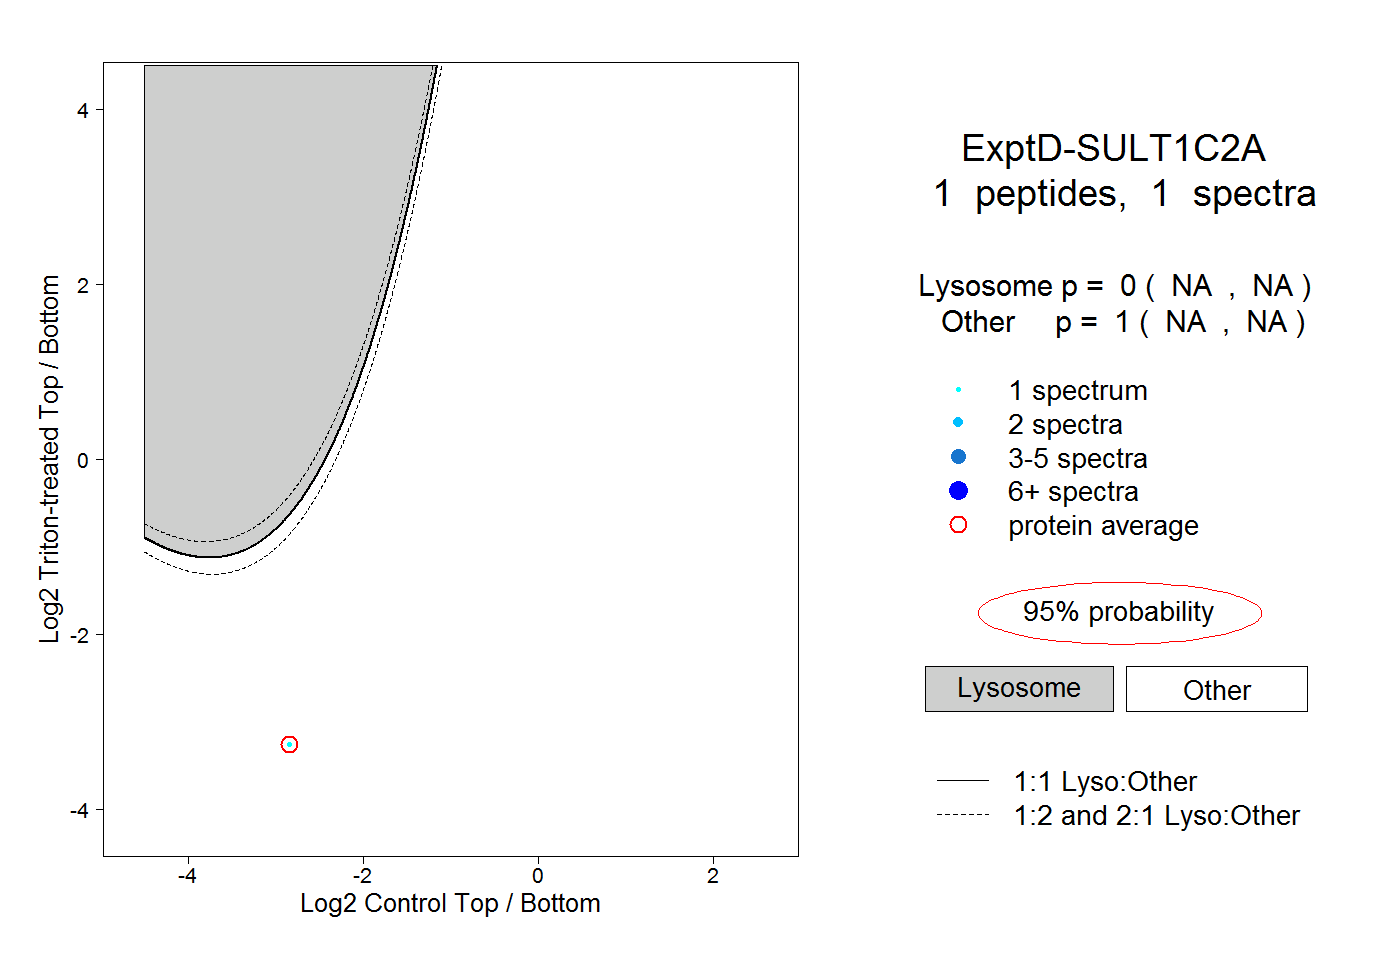 |
0.000 NA | NA |
1.000 NA | NA |