 22
22peptides
spectra
0.000 | 0.000
0.000 | 0.000
0.000 | 0.000
0.042 | 0.066
0.000 | 0.022
0.643 | 0.663
0.258 | 0.266
0.015 | 0.021
2peptides
spectra
NA | NA
NA | NA
NA | NA
NA | NA
NA | NA
NA | NA
NA | NA
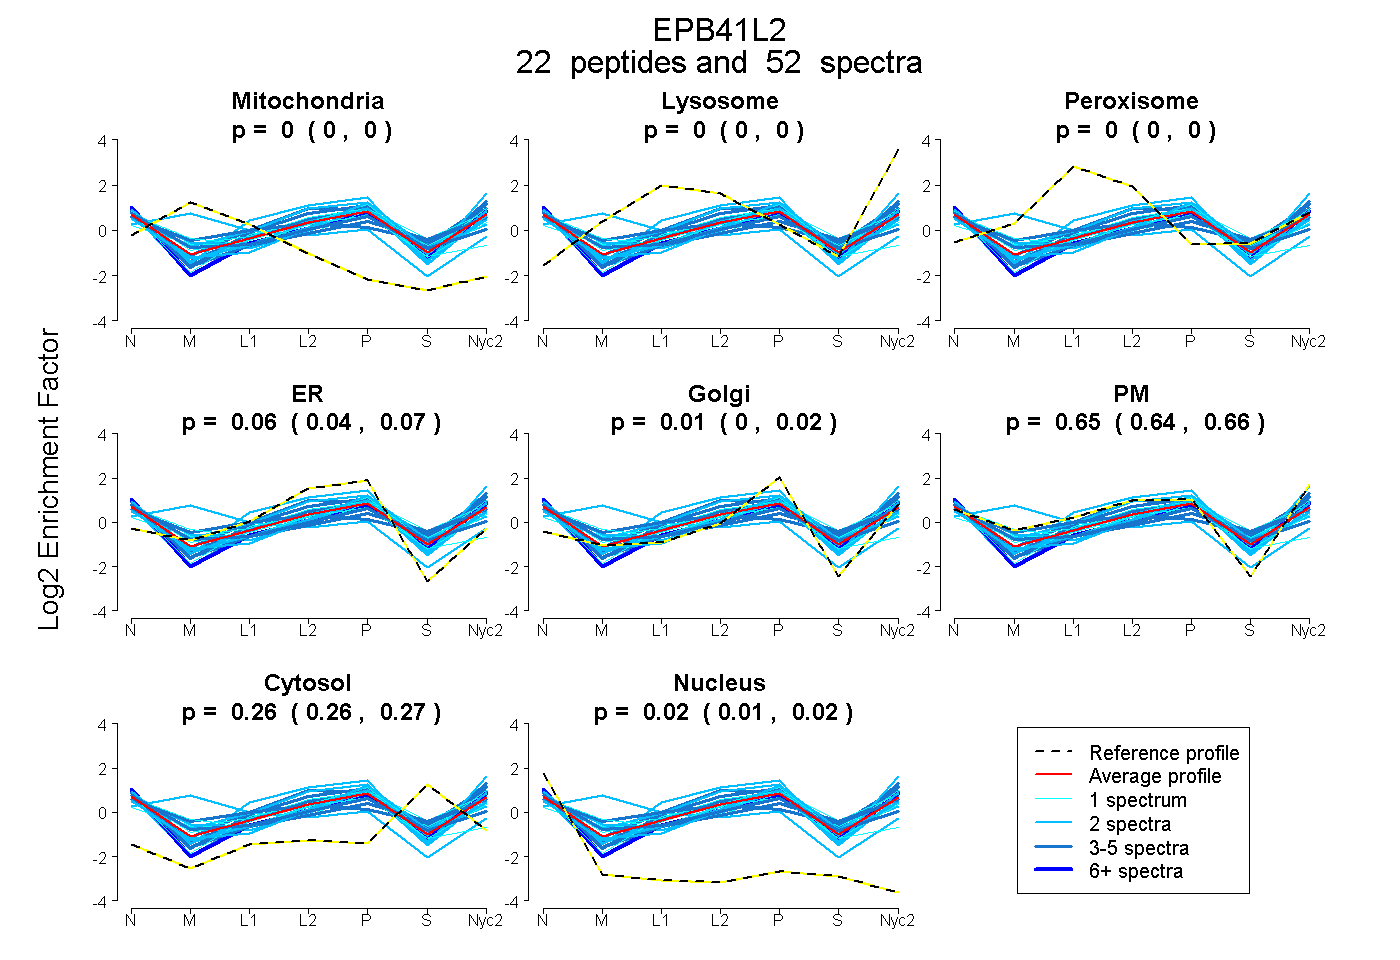
| Plot | Mito | Lyso | Perox | ER | Golgi | PM | Cytosol | Nucleus | |||||
| Expt A |
22 peptides |
52 spectra |
|
0.000 0.000 | 0.000 |
0.000 0.000 | 0.000 |
0.000 0.000 | 0.000 |
0.055 0.042 | 0.066 |
0.011 0.000 | 0.022 |
0.653 0.643 | 0.663 |
0.262 0.258 | 0.266 |
0.018 0.015 | 0.021 |
||
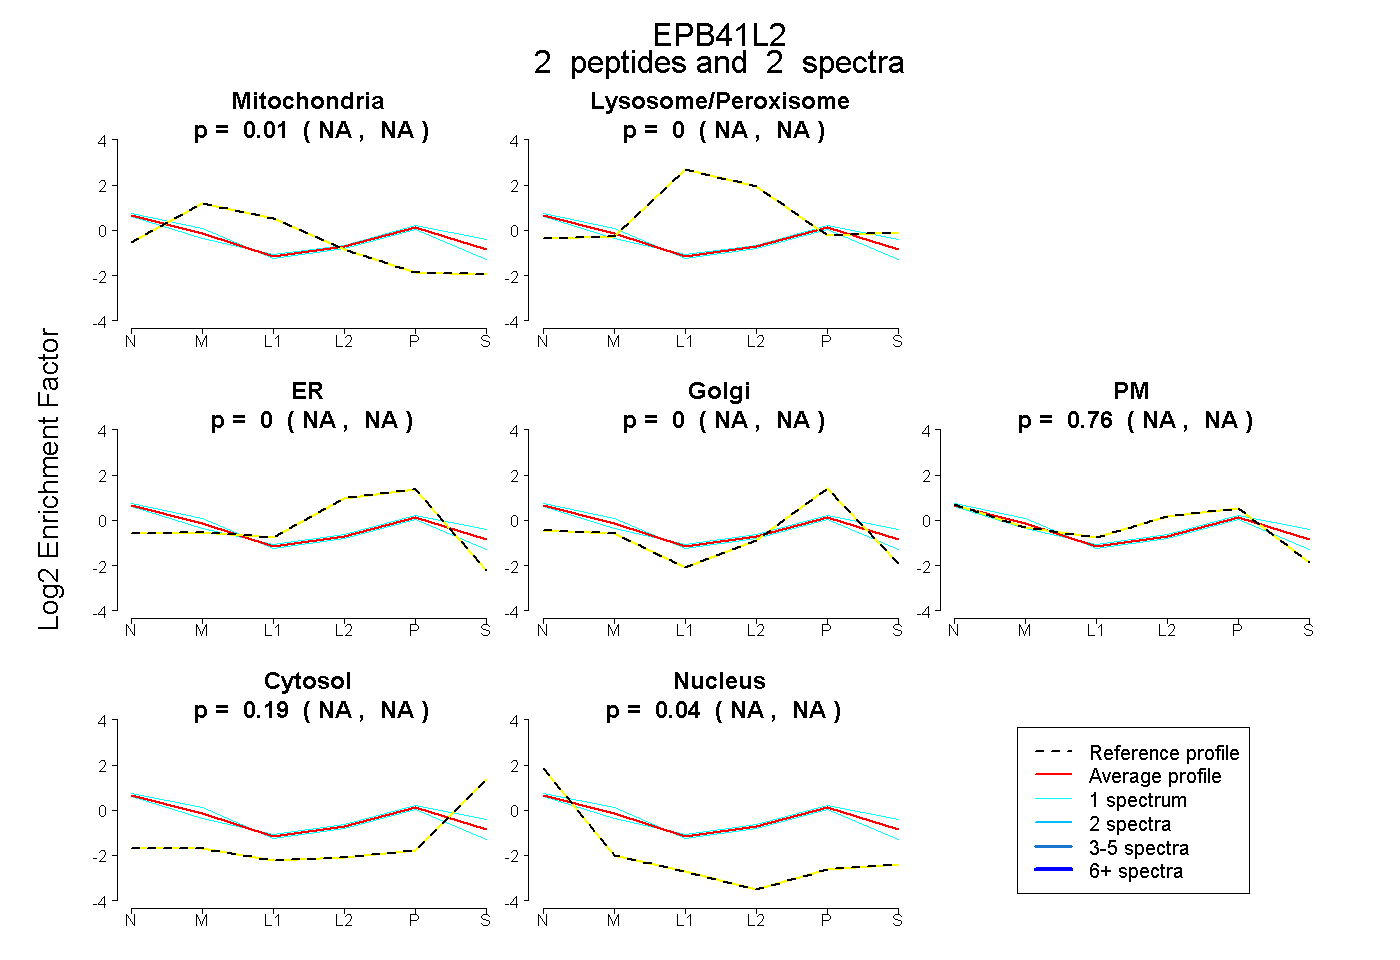
| Plot | Mito | Lyso or Perox | ER | Golgi | PM | Cytosol | Nucleus | ||||||
| Expt B |
2 peptides |
2 spectra |
|
0.012 NA | NA |
0.000 NA | NA |
0.000 NA | NA |
0.000 NA | NA |
0.757 NA | NA |
0.195 NA | NA |
0.036 NA | NA |
| 1 spectrum, VRPGELEQFESTIGFK | 0.000 | 0.014 | 0.000 | 0.000 | 0.724 | 0.262 | 0.000 | |||
| 1 spectrum, VAEIHK | 0.100 | 0.000 | 0.000 | 0.089 | 0.636 | 0.087 | 0.089 |
| Plot | Lyso | Other | |||||||||||
| Expt C |
25 peptides |
66 spectra |
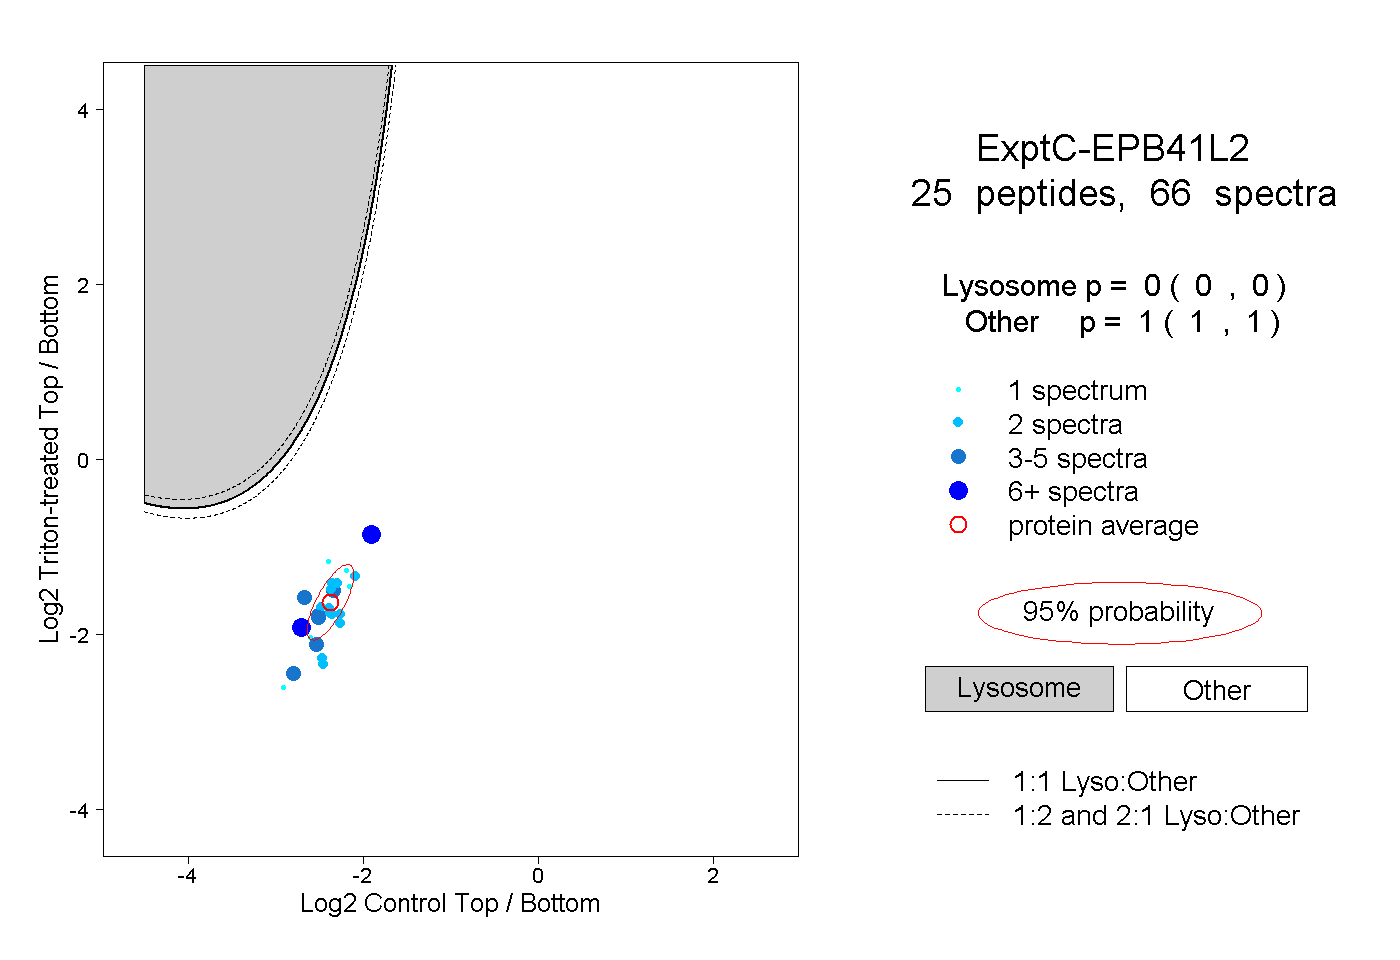 |
0.000 0.000 | 0.000 |
1.000 1.000 | 1.000 |
||||||||
| Plot | Lyso | Other | |||||||||||
| Expt D |
3 peptides |
5 spectra |
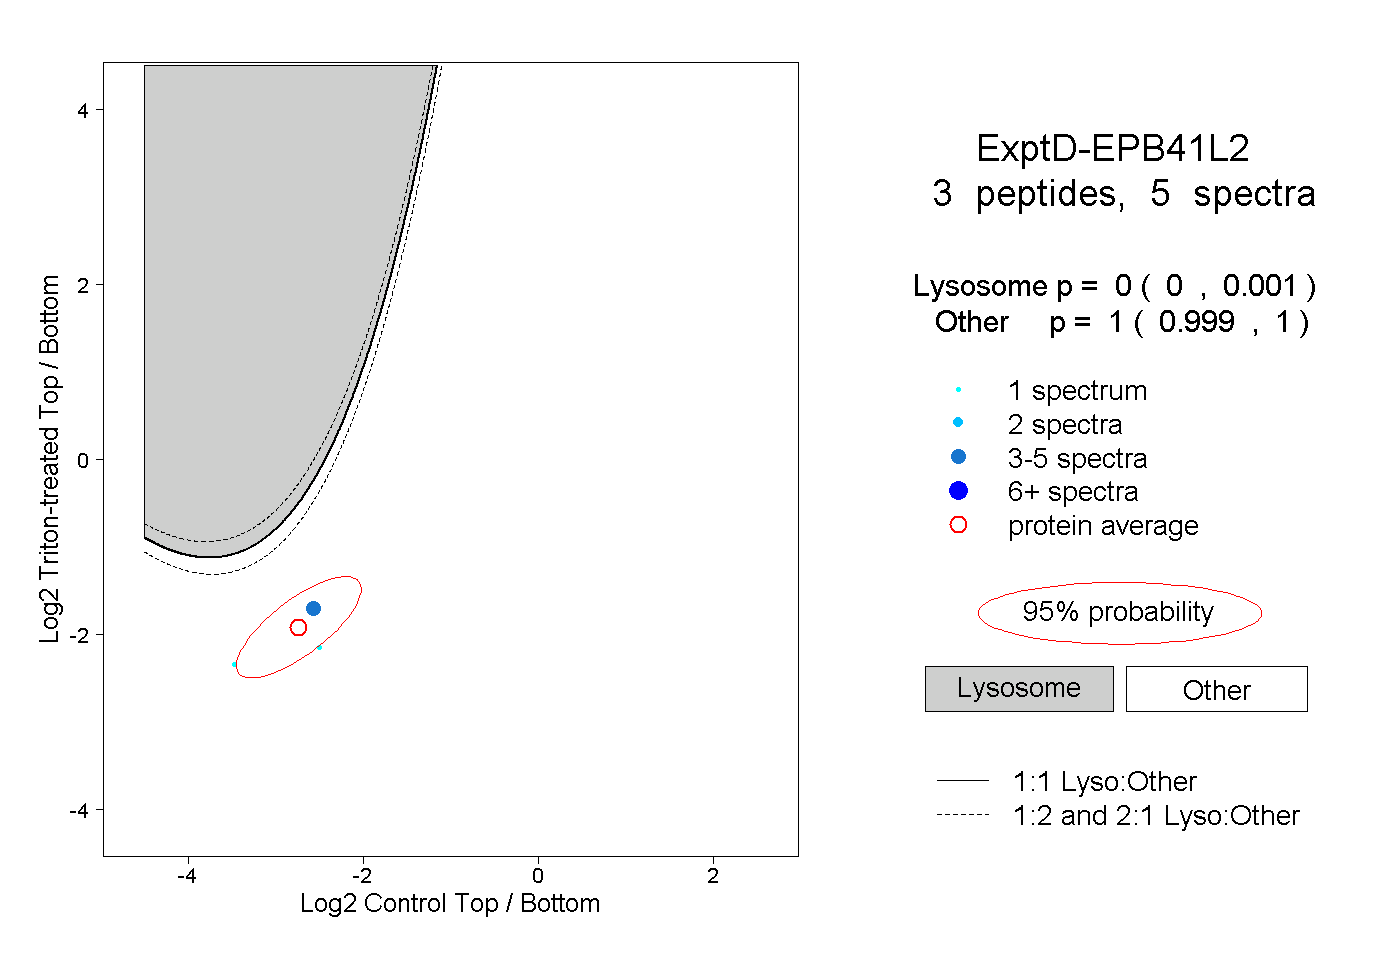 |
0.000 0.000 | 0.001 |
1.000 0.999 | 1.000 |