 1
1peptide
spectra
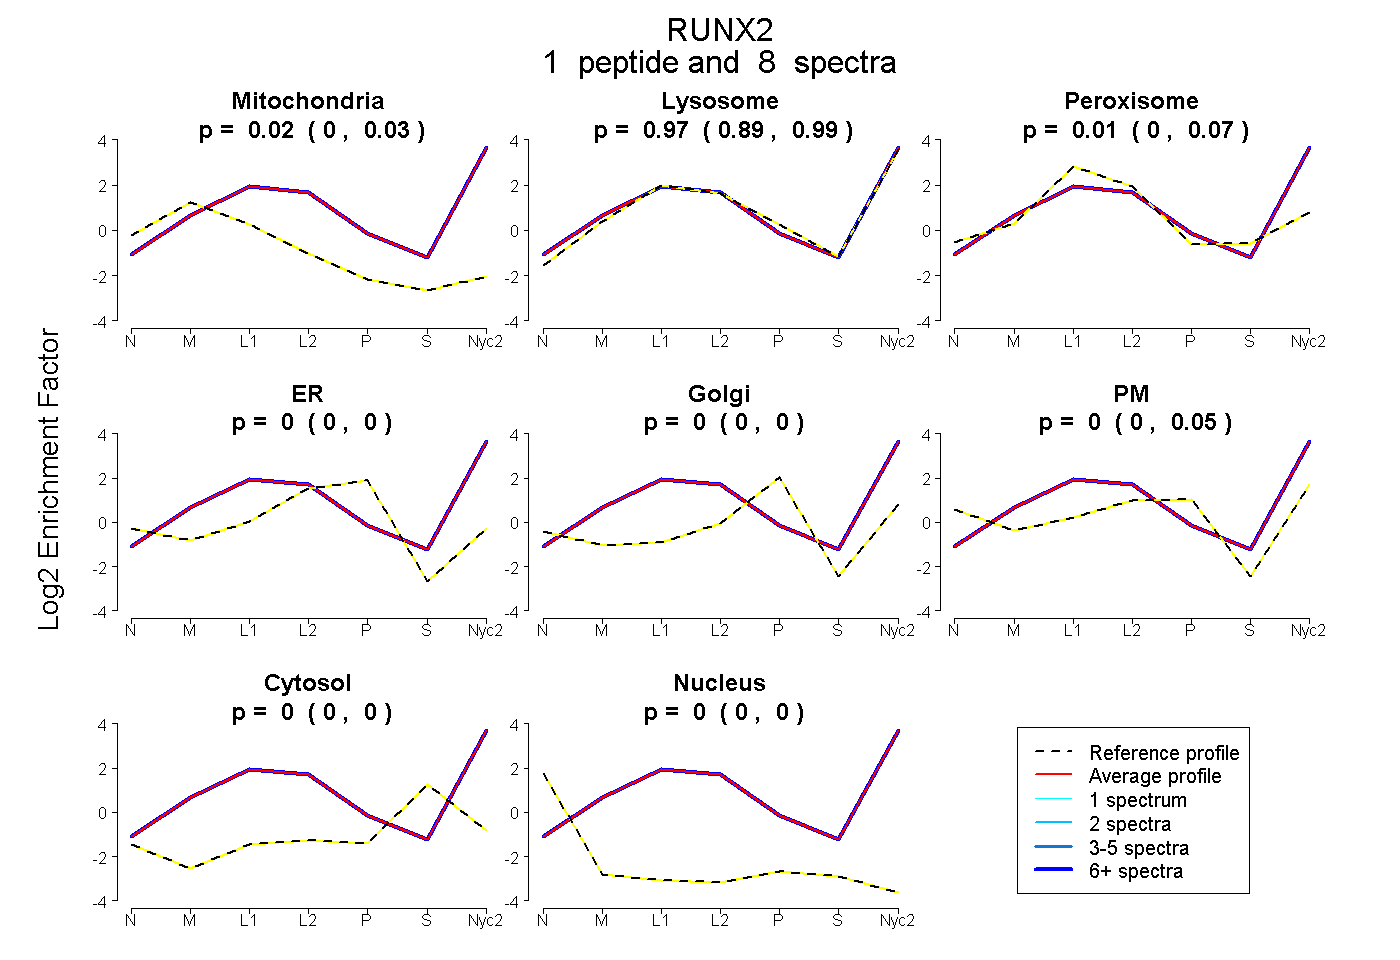
0.000 | 0.035
0.887 | 0.987
0.000 | 0.072
0.000 | 0.000
0.000 | 0.000
0.000 | 0.055
0.000 | 0.000
0.000 | 0.000
1peptide
spectra
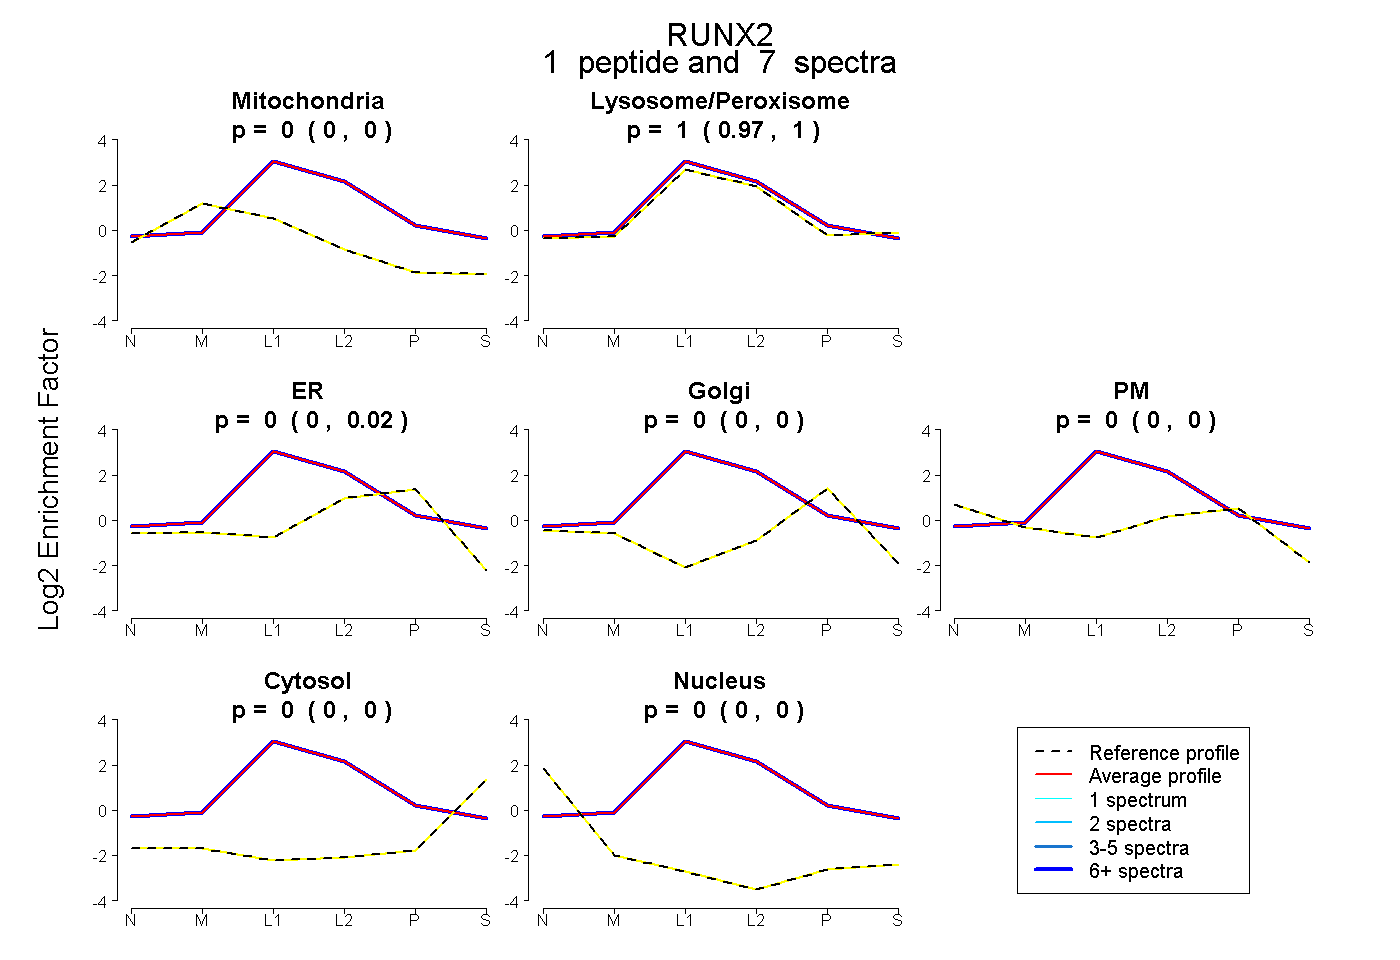
0.000 | 0.000
0.967 | 1.000
0.000 | 0.023
0.000 | 0.000
0.000 | 0.000
0.000 | 0.000
0.000 | 0.000
1peptide
spectra
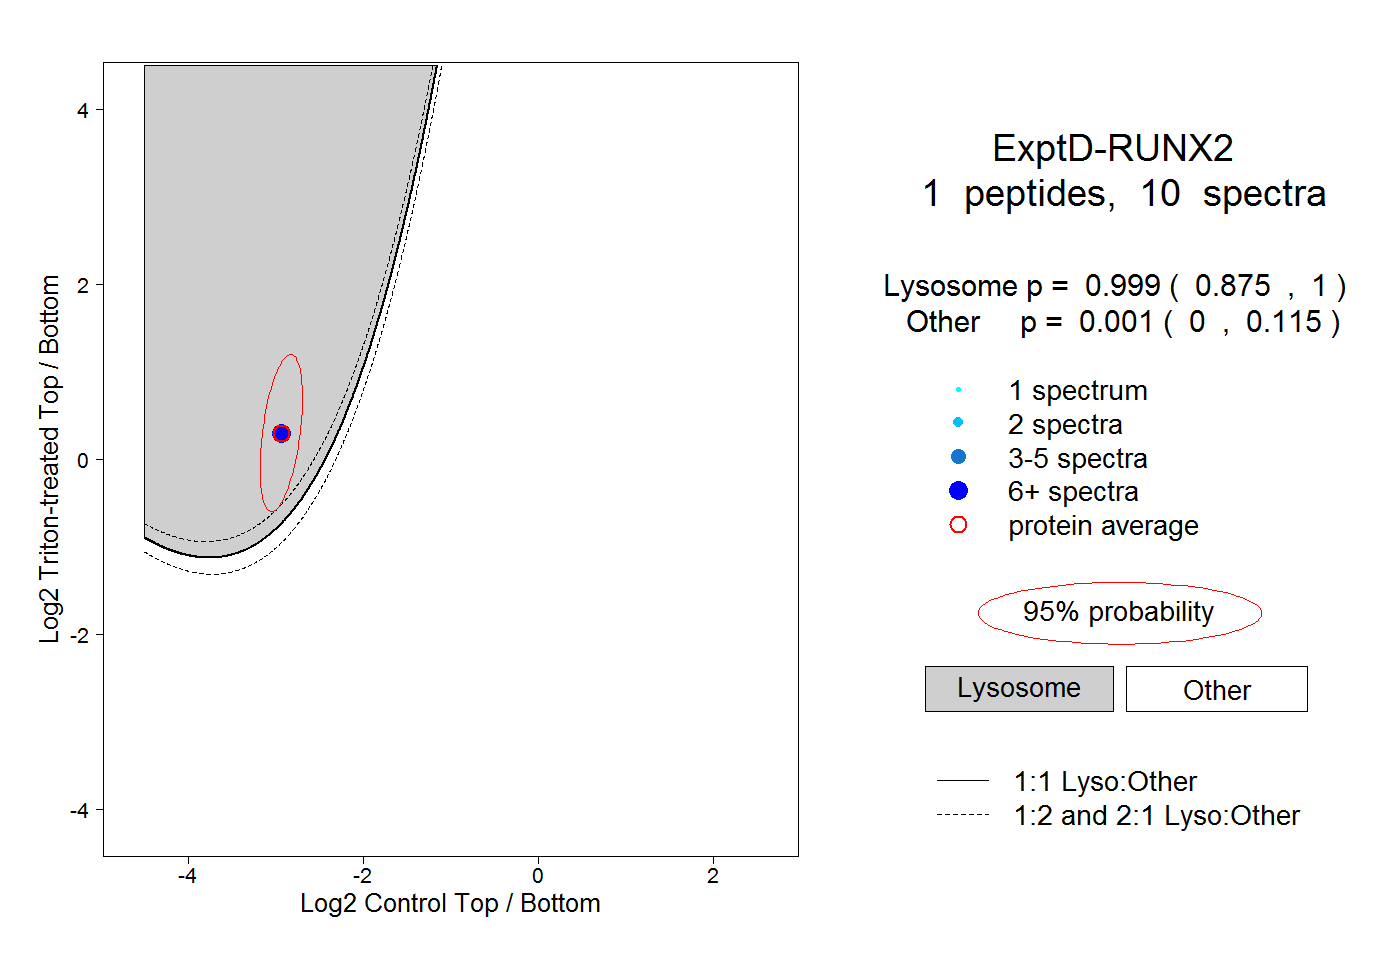
0.875 | 1.000
0.000 | 0.115