 3
3peptides
spectra
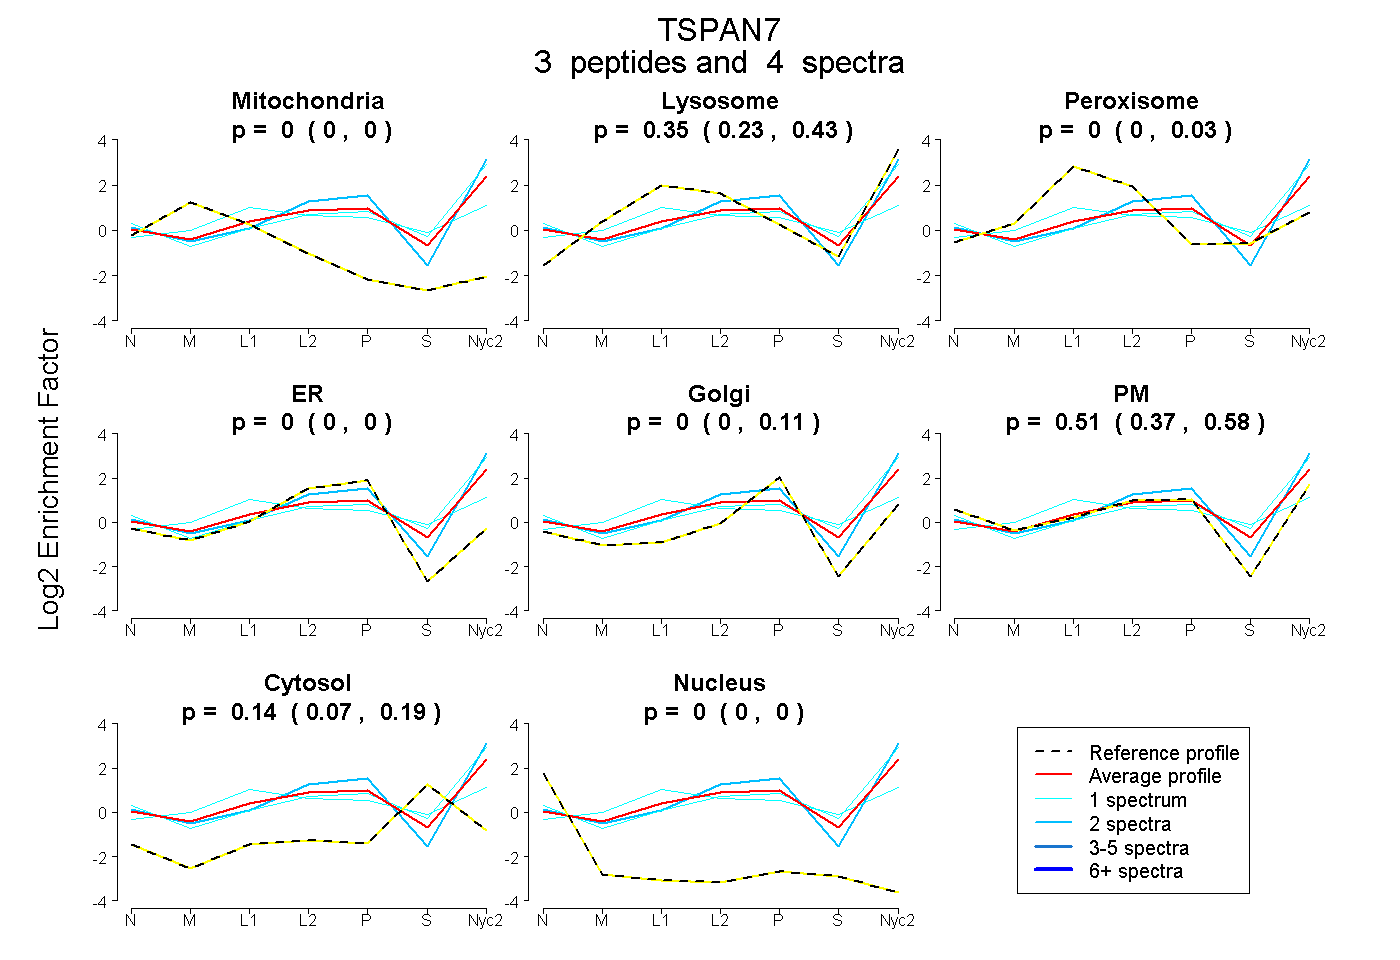
0.000 | 0.000
0.227 | 0.432
0.000 | 0.028
0.000 | 0.000
0.000 | 0.113
0.370 | 0.578
0.072 | 0.188
0.000 | 0.000
1peptide
spectra
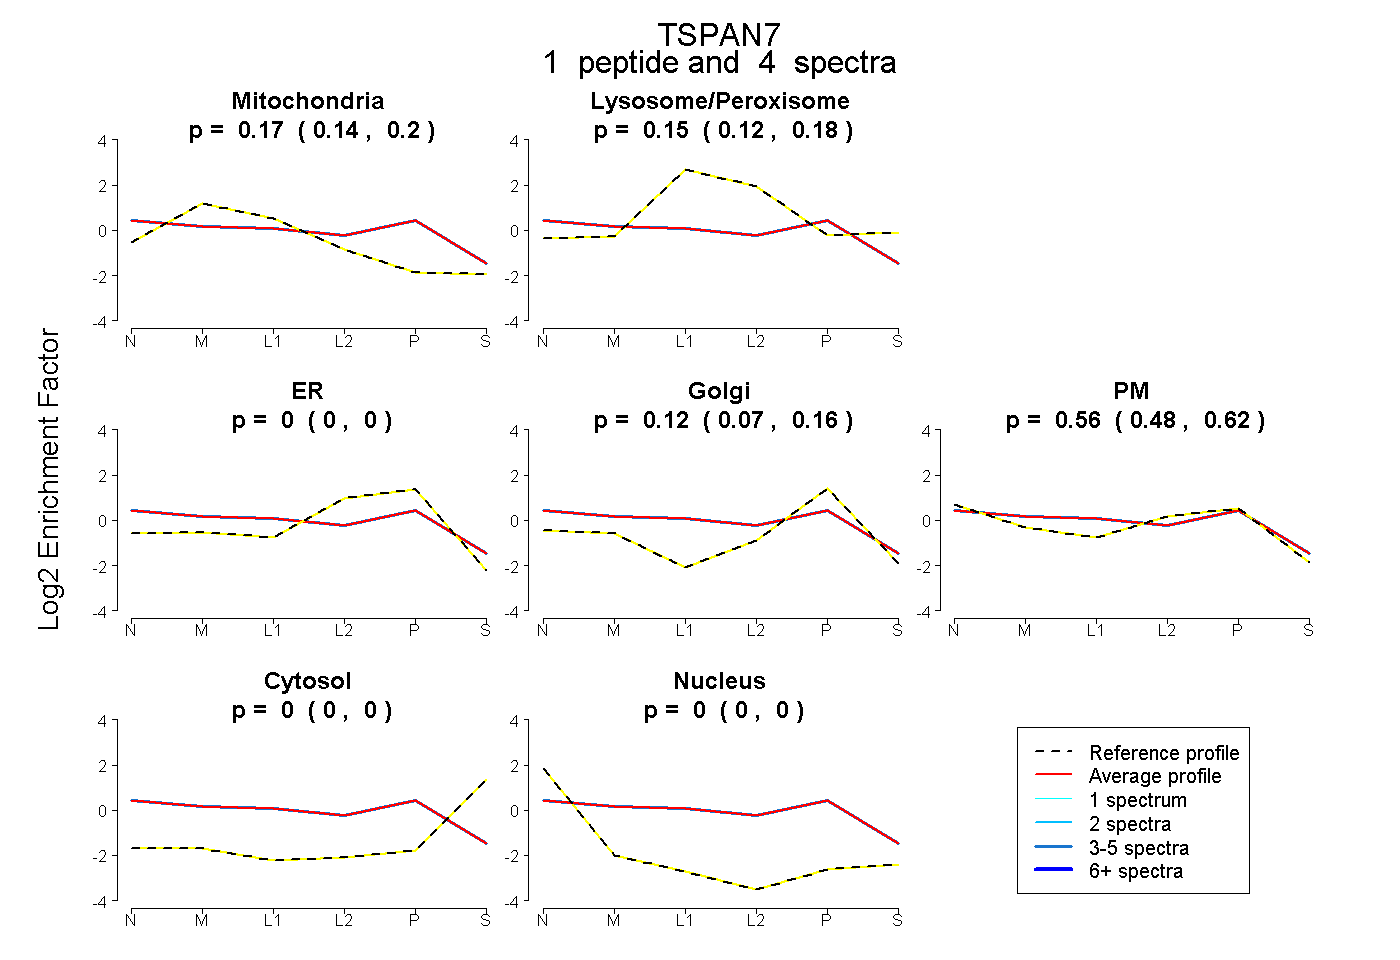
0.141 | 0.198
0.122 | 0.179
0.000 | 0.000
0.067 | 0.161
0.479 | 0.618
0.000 | 0.000
0.000 | 0.000
1peptide
spectra
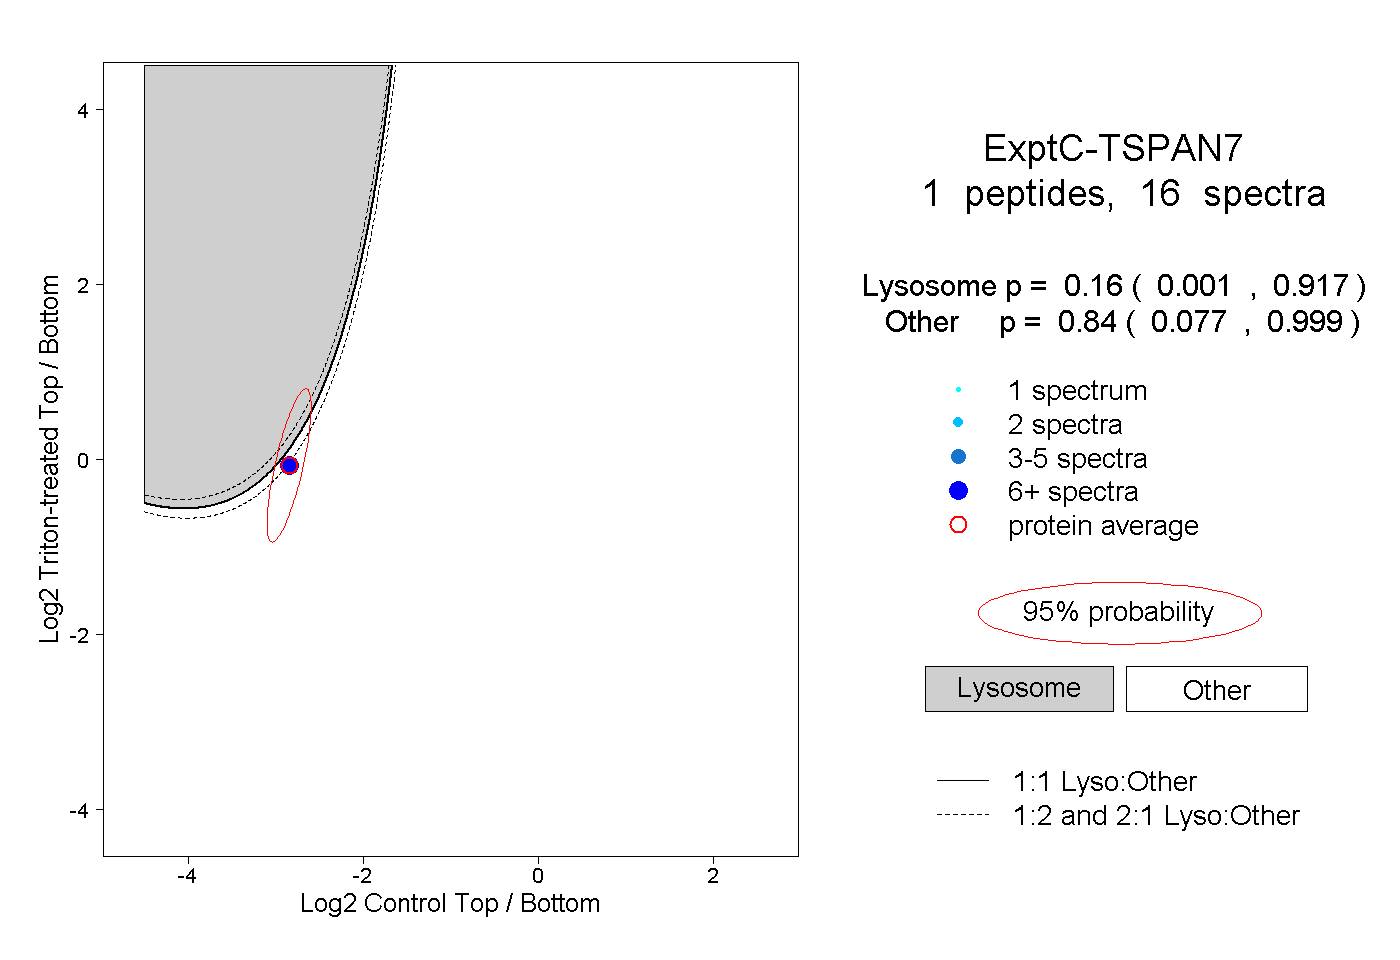
0.001 | 0.917
0.077 | 0.999