 12
12peptides
spectra
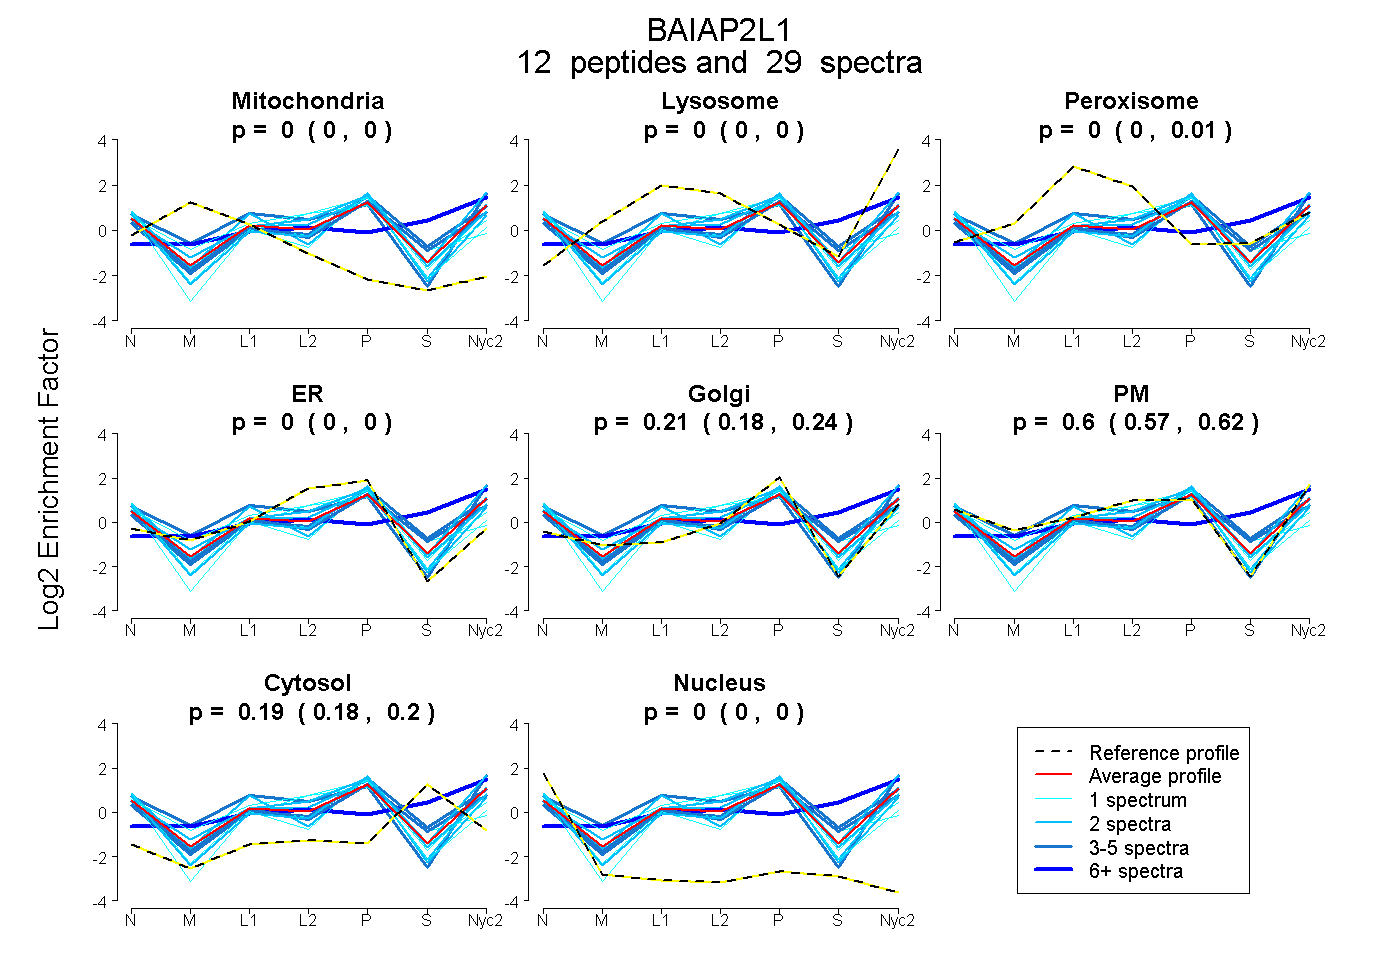
0.000 | 0.000
0.000 | 0.000
0.000 | 0.006
0.000 | 0.000
0.180 | 0.240
0.566 | 0.617
0.177 | 0.203
0.000 | 0.000
| Plot | Mito | Lyso | Perox | ER | Golgi | PM | Cytosol | Nucleus | |||||
| Expt A |
12 peptides |
29 spectra |
|
0.000 0.000 | 0.000 |
0.000 0.000 | 0.000 |
0.000 0.000 | 0.006 |
0.000 0.000 | 0.000 |
0.213 0.180 | 0.240 |
0.596 0.566 | 0.617 |
0.191 0.177 | 0.203 |
0.000 0.000 | 0.000 |
| 1 spectrum, SAPLIR | 0.000 | 0.000 | 0.000 | 0.000 | 0.394 | 0.426 | 0.119 | 0.061 | ||
| 1 spectrum, IMNMIEEIK | 0.000 | 0.000 | 0.082 | 0.473 | 0.048 | 0.321 | 0.000 | 0.076 | ||
| 3 spectra, ILEENMK | 0.000 | 0.004 | 0.009 | 0.000 | 0.344 | 0.385 | 0.258 | 0.000 | ||
| 2 spectra, GWFPSSYTK | 0.000 | 0.000 | 0.107 | 0.000 | 0.487 | 0.306 | 0.000 | 0.100 | ||
| 3 spectra, AYYDGVAK | 0.000 | 0.000 | 0.039 | 0.000 | 0.027 | 0.924 | 0.000 | 0.010 | ||
| 7 spectra, ILAGK | 0.000 | 0.377 | 0.000 | 0.000 | 0.000 | 0.168 | 0.455 | 0.000 | ||
| 2 spectra, EIEYVETVTSR | 0.000 | 0.000 | 0.000 | 0.000 | 0.287 | 0.624 | 0.037 | 0.052 | ||
| 2 spectra, TIFPHTAGNNK | 0.000 | 0.000 | 0.000 | 0.000 | 0.487 | 0.329 | 0.144 | 0.041 | ||
| 1 spectrum, IPSTSTFK | 0.000 | 0.000 | 0.000 | 0.000 | 0.616 | 0.127 | 0.184 | 0.073 | ||
| 4 spectra, SISTVDLTEK | 0.000 | 0.000 | 0.013 | 0.000 | 0.274 | 0.438 | 0.275 | 0.000 | ||
| 1 spectrum, FCFLVDK | 0.000 | 0.000 | 0.033 | 0.428 | 0.000 | 0.264 | 0.254 | 0.021 | ||
| 2 spectra, YMNATLK | 0.000 | 0.058 | 0.000 | 0.000 | 0.205 | 0.637 | 0.101 | 0.000 |
| Plot | Mito | Lyso or Perox | ER | Golgi | PM | Cytosol | Nucleus | ||||||
| Expt B |
3 peptides |
4 spectra |
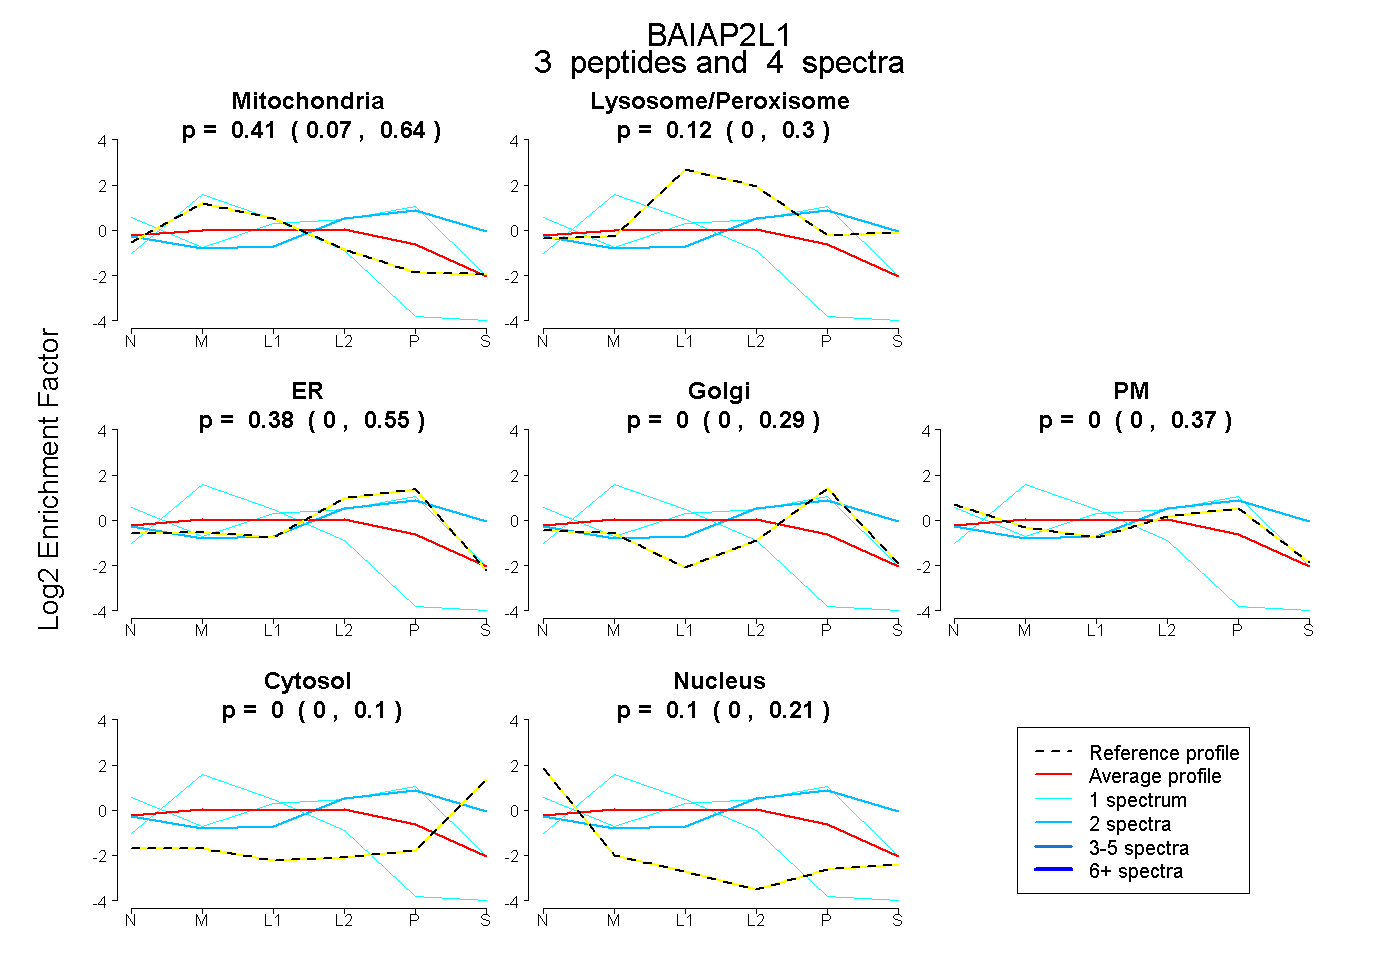 |
0.409 0.071 | 0.643 |
0.116 0.000 | 0.301 |
0.376 0.000 | 0.552 |
0.000 0.000 | 0.290 |
0.000 0.000 | 0.368 |
0.000 0.000 | 0.103 |
0.099 0.000 | 0.206 |
|||
| Plot | Lyso | Other | |||||||||||
| Expt C |
14 peptides |
84 spectra |
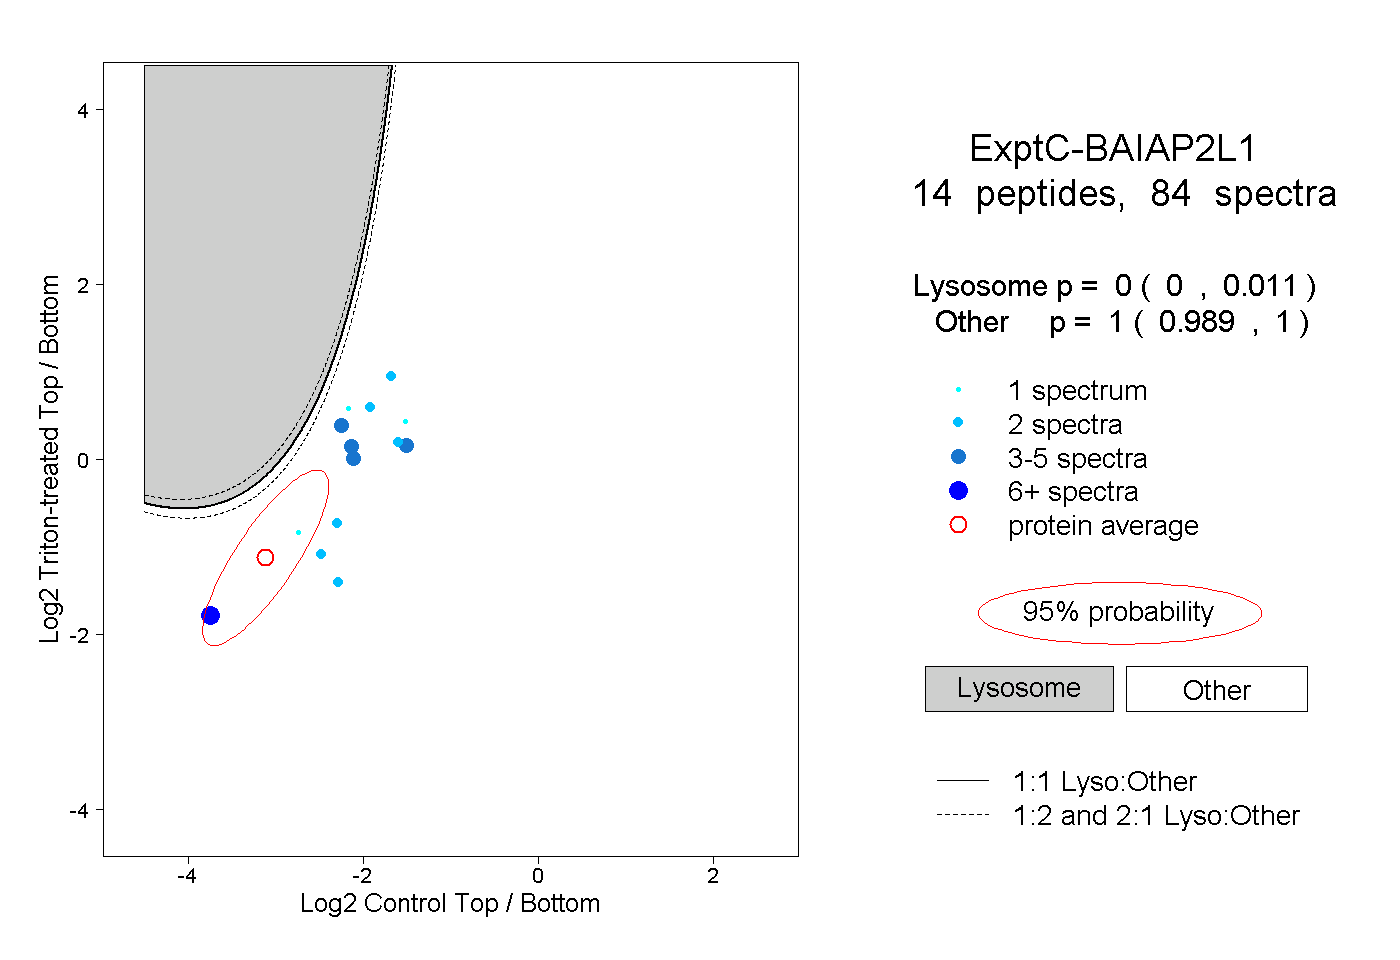 |
0.000 0.000 | 0.011 |
1.000 0.989 | 1.000 |
||||||||
| Plot | Lyso | Other | |||||||||||
| Expt D |
1 peptide |
1 spectrum |
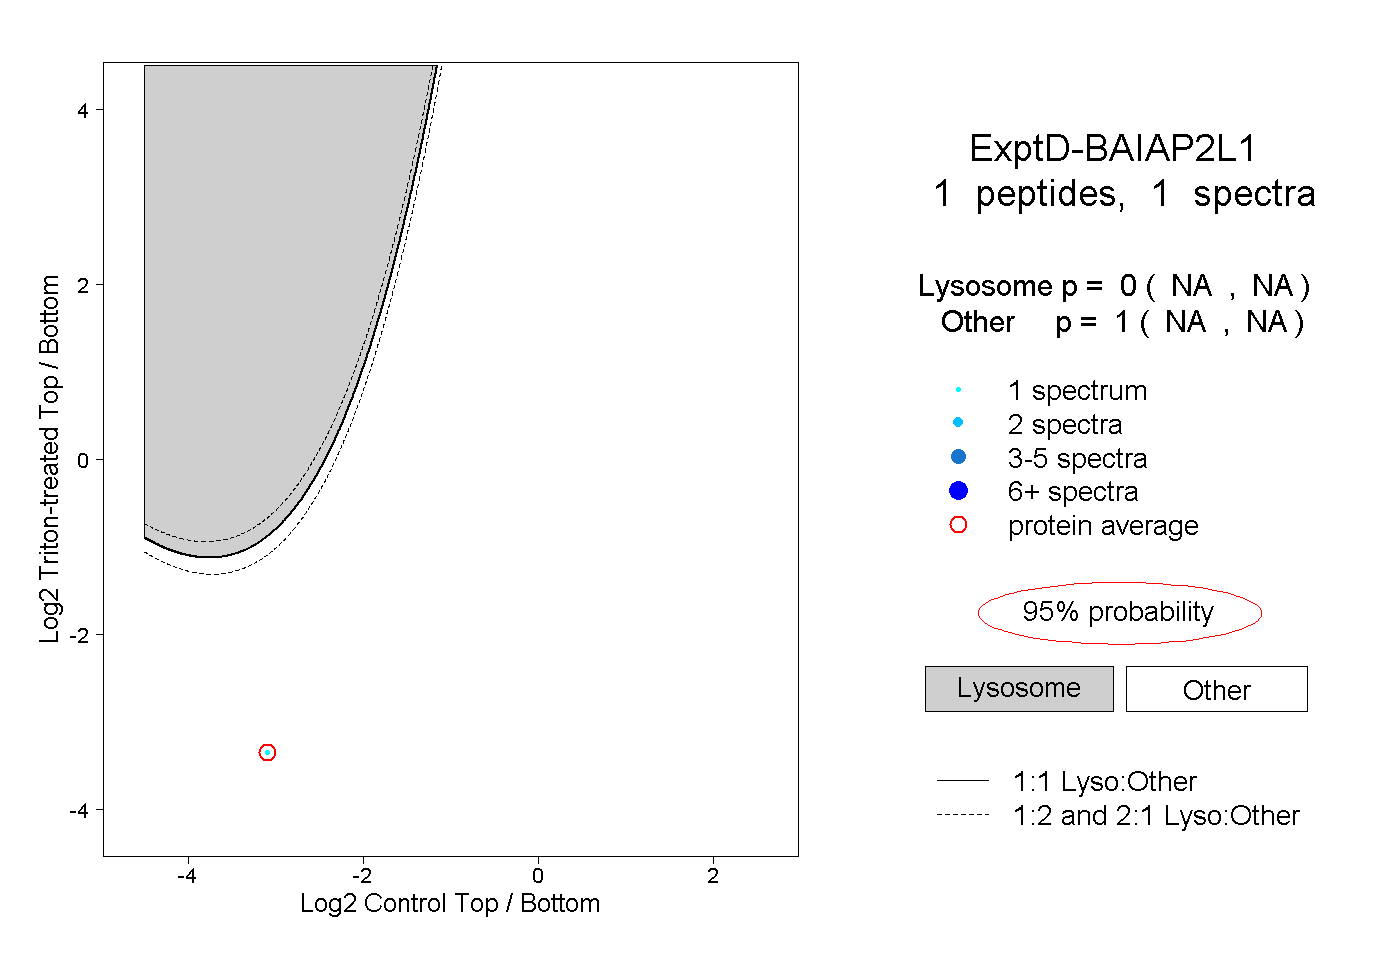 |
0.000 NA | NA |
1.000 NA | NA |