 3
3peptides
spectra
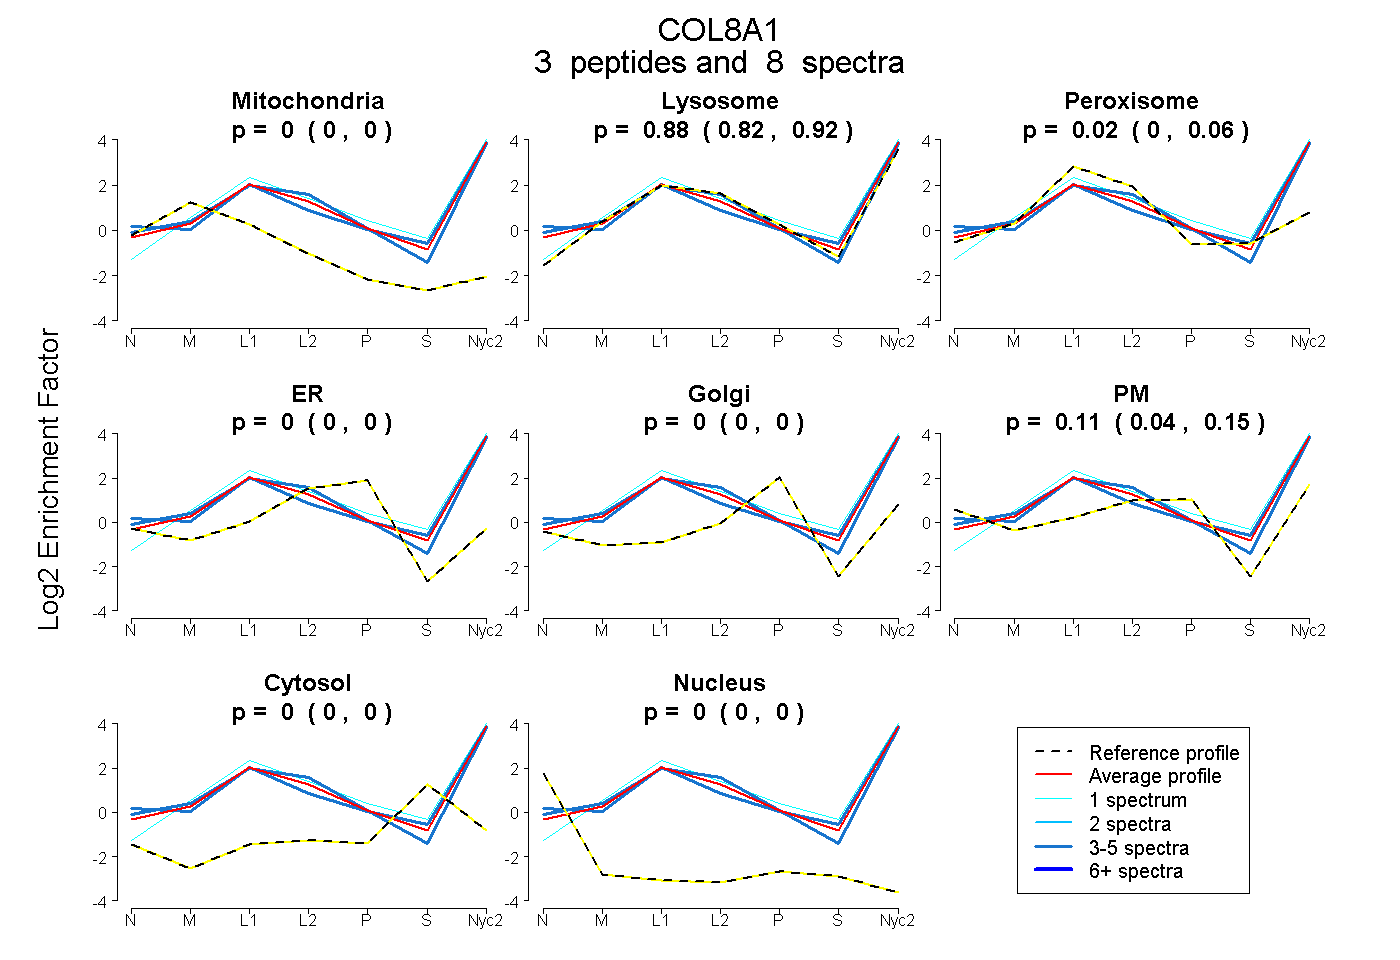
0.000 | 0.000
0.824 | 0.921
0.000 | 0.055
0.000 | 0.000
0.000 | 0.000
0.043 | 0.152
0.000 | 0.003
0.000 | 0.005
| Plot | Mito | Lyso | Perox | ER | Golgi | PM | Cytosol | Nucleus | |||||
| Expt A |
3 peptides |
8 spectra |
|
0.000 0.000 | 0.000 |
0.876 0.824 | 0.921 |
0.016 0.000 | 0.055 |
0.000 0.000 | 0.000 |
0.000 0.000 | 0.000 |
0.108 0.043 | 0.152 |
0.000 0.000 | 0.003 |
0.000 0.000 | 0.005 |
| 3 spectra, GGNVWVALFK | 0.000 | 0.790 | 0.031 | 0.000 | 0.000 | 0.163 | 0.016 | 0.000 | ||
| 1 spectrum, GFLDQASGSAVLLLRPGDR | 0.000 | 1.000 | 0.000 | 0.000 | 0.000 | 0.000 | 0.000 | 0.000 | ||
| 4 spectra, LLYNGR | 0.000 | 0.809 | 0.000 | 0.000 | 0.000 | 0.191 | 0.000 | 0.000 |
| Plot | Lyso | Other | |||||||||||
| Expt C |
2 peptides |
6 spectra |
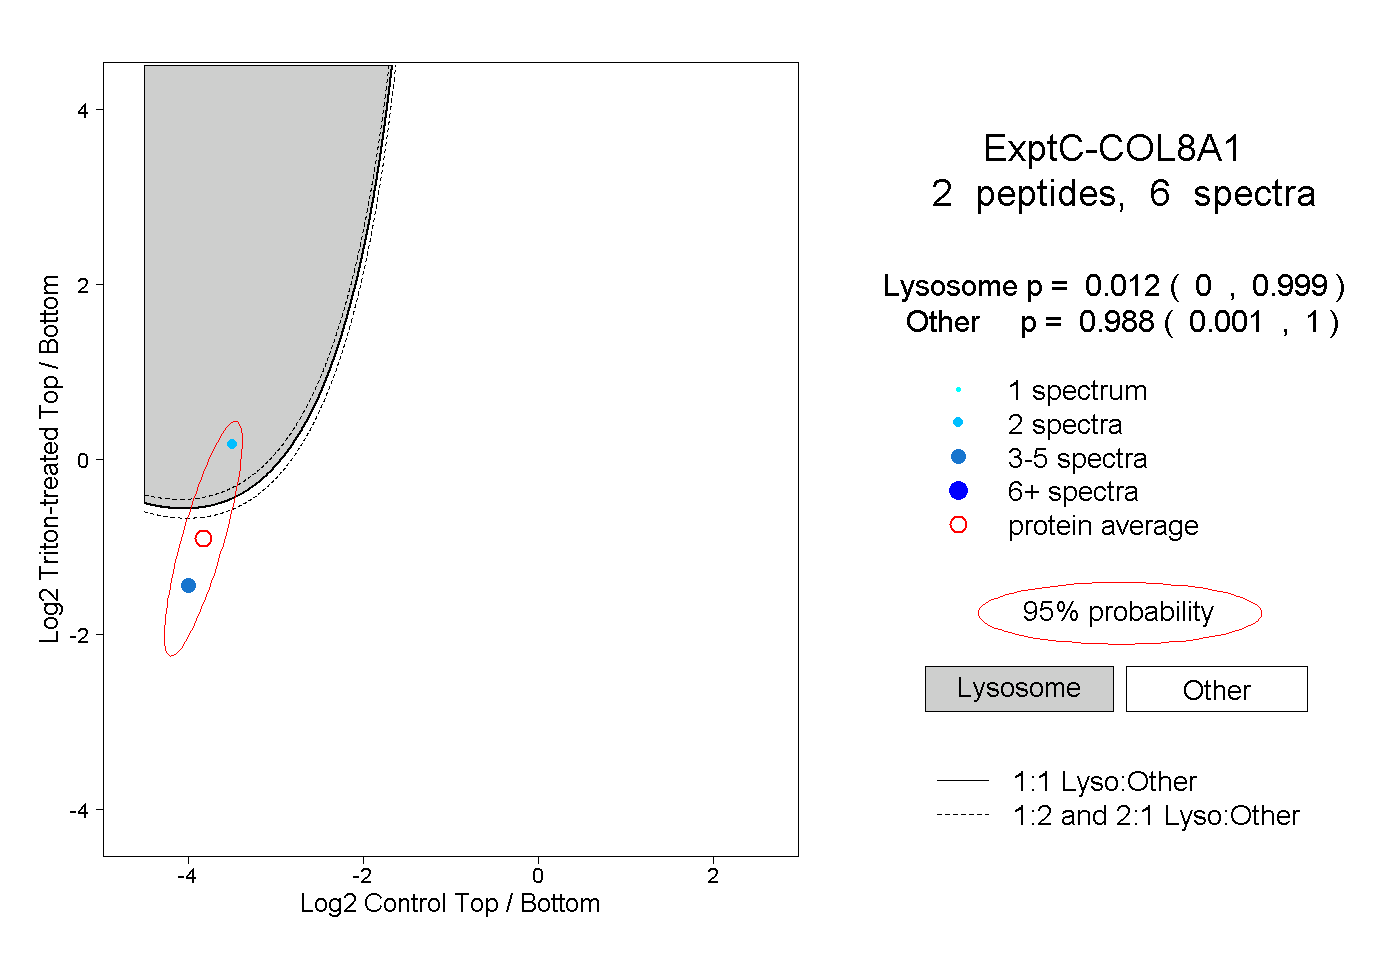 |
0.012 0.000 | 0.999 |
0.988 0.001 | 1.000 |