 5
5peptides
spectra
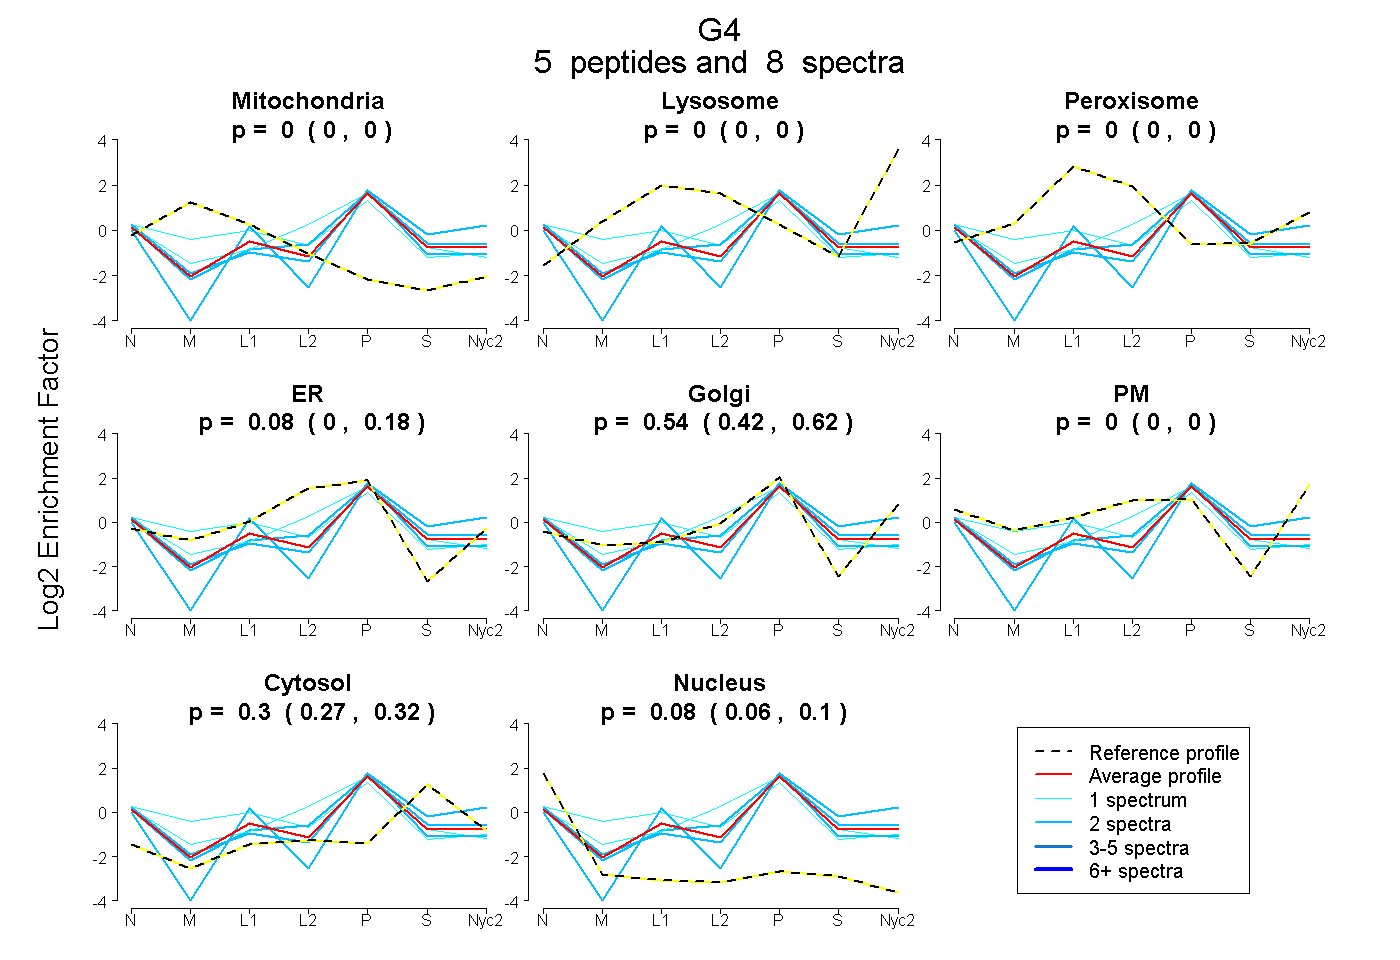
0.000 | 0.000
0.000 | 0.000
0.000 | 0.000
0.000 | 0.184
0.418 | 0.618
0.000 | 0.000
0.272 | 0.323
0.056 | 0.102
| Plot | Mito | Lyso | Perox | ER | Golgi | PM | Cytosol | Nucleus | |||||
| Expt A |
5 peptides |
8 spectra |
|
0.000 0.000 | 0.000 |
0.000 0.000 | 0.000 |
0.000 0.000 | 0.000 |
0.080 0.000 | 0.184 |
0.537 0.418 | 0.618 |
0.000 0.000 | 0.000 |
0.300 0.272 | 0.323 |
0.082 0.056 | 0.102 |
| 2 spectra, AILDALGLR | 0.000 | 0.000 | 0.000 | 0.153 | 0.460 | 0.000 | 0.339 | 0.048 | ||
| 1 spectrum, EQTEGPGR | 0.000 | 0.000 | 0.000 | 0.616 | 0.030 | 0.000 | 0.291 | 0.063 | ||
| 2 spectra, NLGVSPQGR | 0.000 | 0.000 | 0.000 | 0.000 | 0.632 | 0.000 | 0.206 | 0.163 | ||
| 2 spectra, LDLDPVDSGGMK | 0.000 | 0.000 | 0.000 | 0.000 | 0.496 | 0.000 | 0.488 | 0.016 | ||
| 1 spectrum, AASAIQESAR | 0.196 | 0.000 | 0.030 | 0.250 | 0.352 | 0.000 | 0.143 | 0.029 |
| Plot | Lyso | Other | |||||||||||
| Expt C |
3 peptides |
4 spectra |
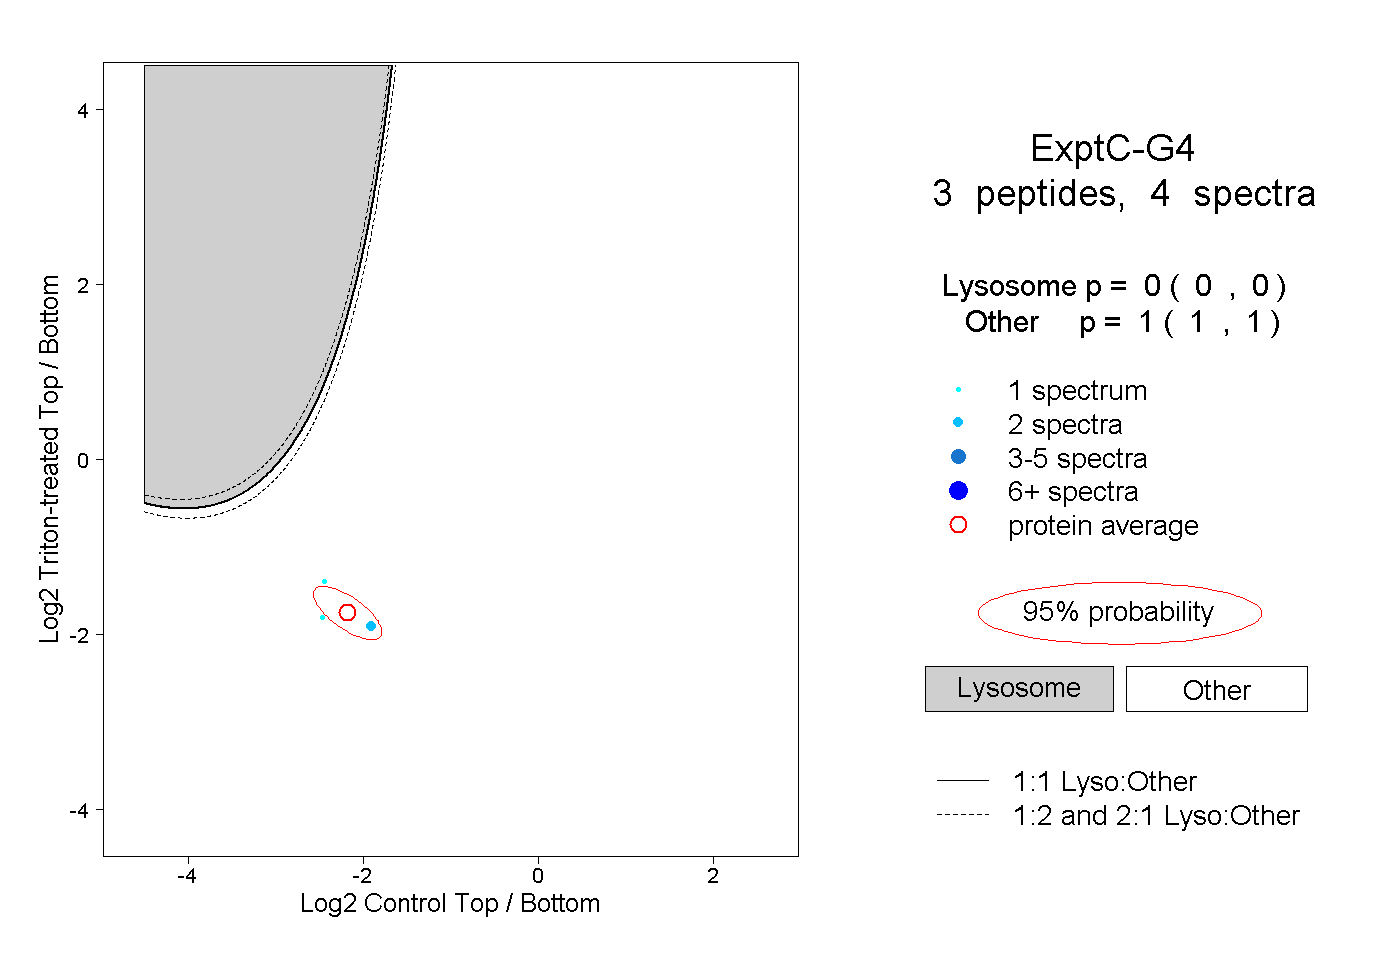 |
0.000 0.000 | 0.000 |
1.000 1.000 | 1.000 |