 5
5peptides
spectra
0.000 | 0.000
0.631 | 0.919
0.000 | 0.205
0.000 | 0.152
0.000 | 0.000
0.000 | 0.022
0.000 | 0.085
0.000 | 0.000
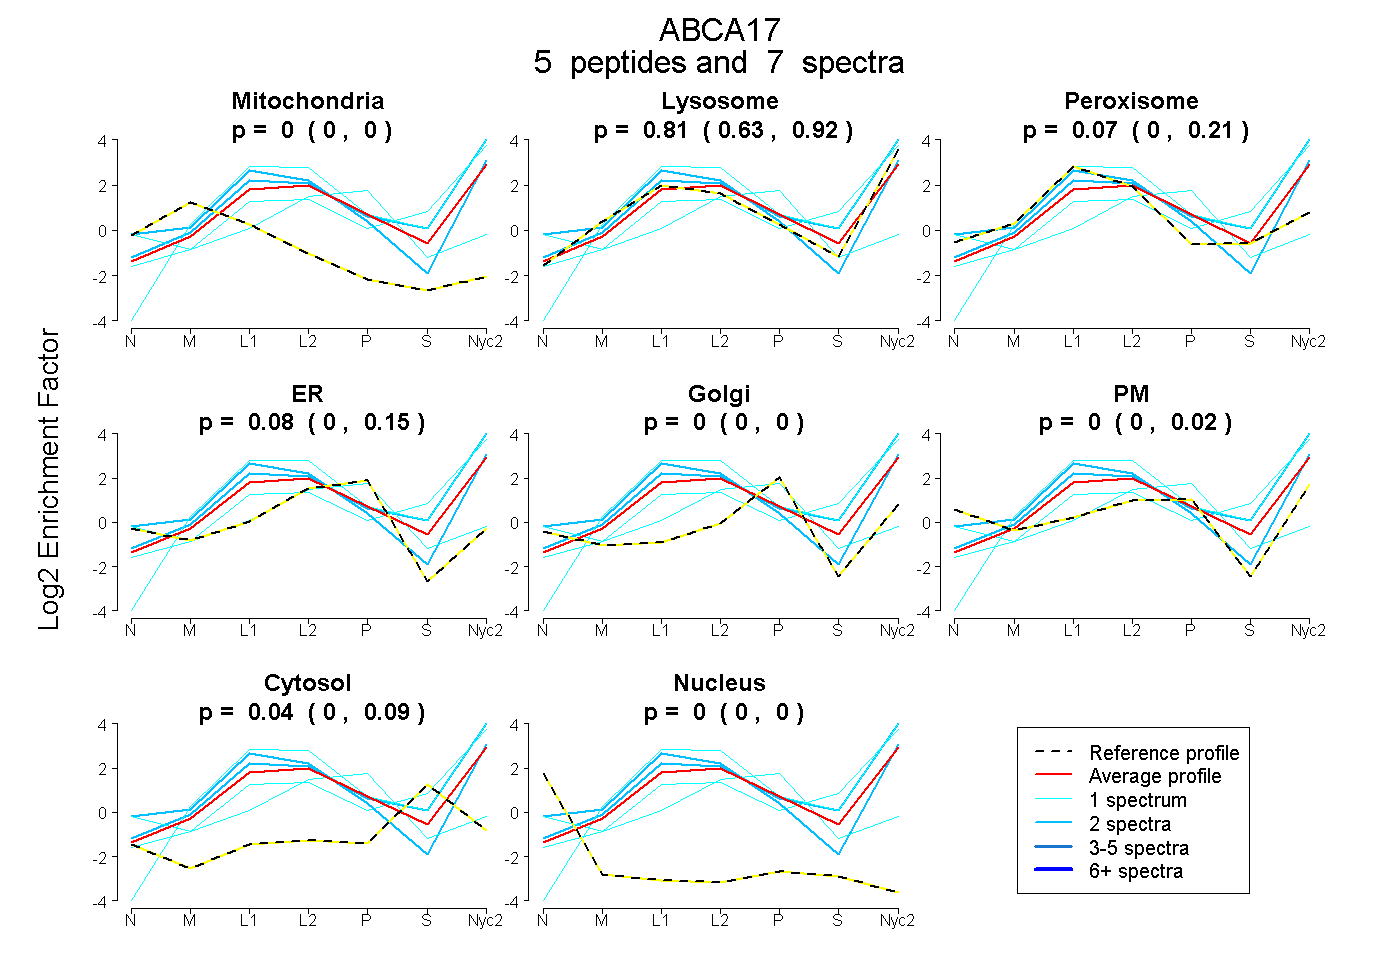
| Plot | Mito | Lyso | Perox | ER | Golgi | PM | Cytosol | Nucleus | |||||
| Expt A |
5 peptides |
7 spectra |
|
0.000 0.000 | 0.000 |
0.806 0.631 | 0.919 |
0.074 0.000 | 0.205 |
0.077 0.000 | 0.152 |
0.000 0.000 | 0.000 |
0.000 0.000 | 0.022 |
0.044 0.000 | 0.085 |
0.000 0.000 | 0.000 |
| 2 spectra, AIWDLLQQQK | 0.000 | 1.000 | 0.000 | 0.000 | 0.000 | 0.000 | 0.000 | 0.000 | ||
| 1 spectrum, NFVLK | 0.000 | 0.000 | 0.110 | 0.763 | 0.000 | 0.000 | 0.127 | 0.000 | ||
| 1 spectrum, TVLLTTHFMDEADLLGDR | 0.000 | 1.000 | 0.000 | 0.000 | 0.000 | 0.000 | 0.000 | 0.000 | ||
| 2 spectra, GELQCCGTPSFLK | 0.000 | 0.612 | 0.205 | 0.000 | 0.000 | 0.183 | 0.000 | 0.000 | ||
| 1 spectrum, FLSGGIK | 0.000 | 0.802 | 0.000 | 0.000 | 0.000 | 0.000 | 0.198 | 0.000 |
| Plot | Lyso | Other | |||||||||||
| Expt C |
7 peptides |
20 spectra |
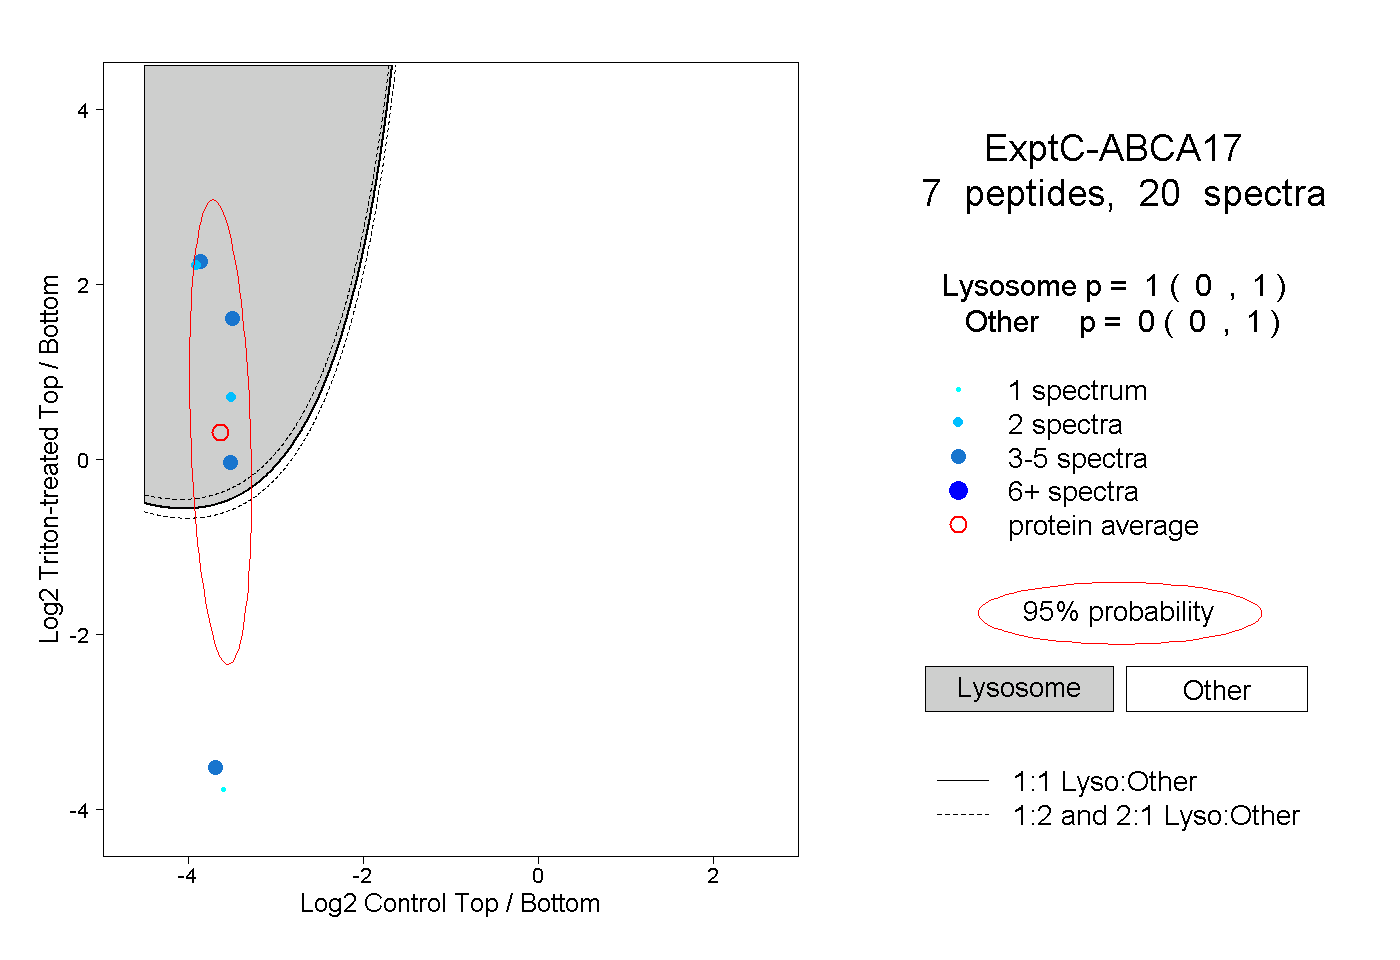 |
1.000 0.000 | 1.000 |
0.000 0.000 | 1.000 |
||||||||
| Plot | Lyso | Other | |||||||||||
| Expt D |
1 peptide |
1 spectrum |
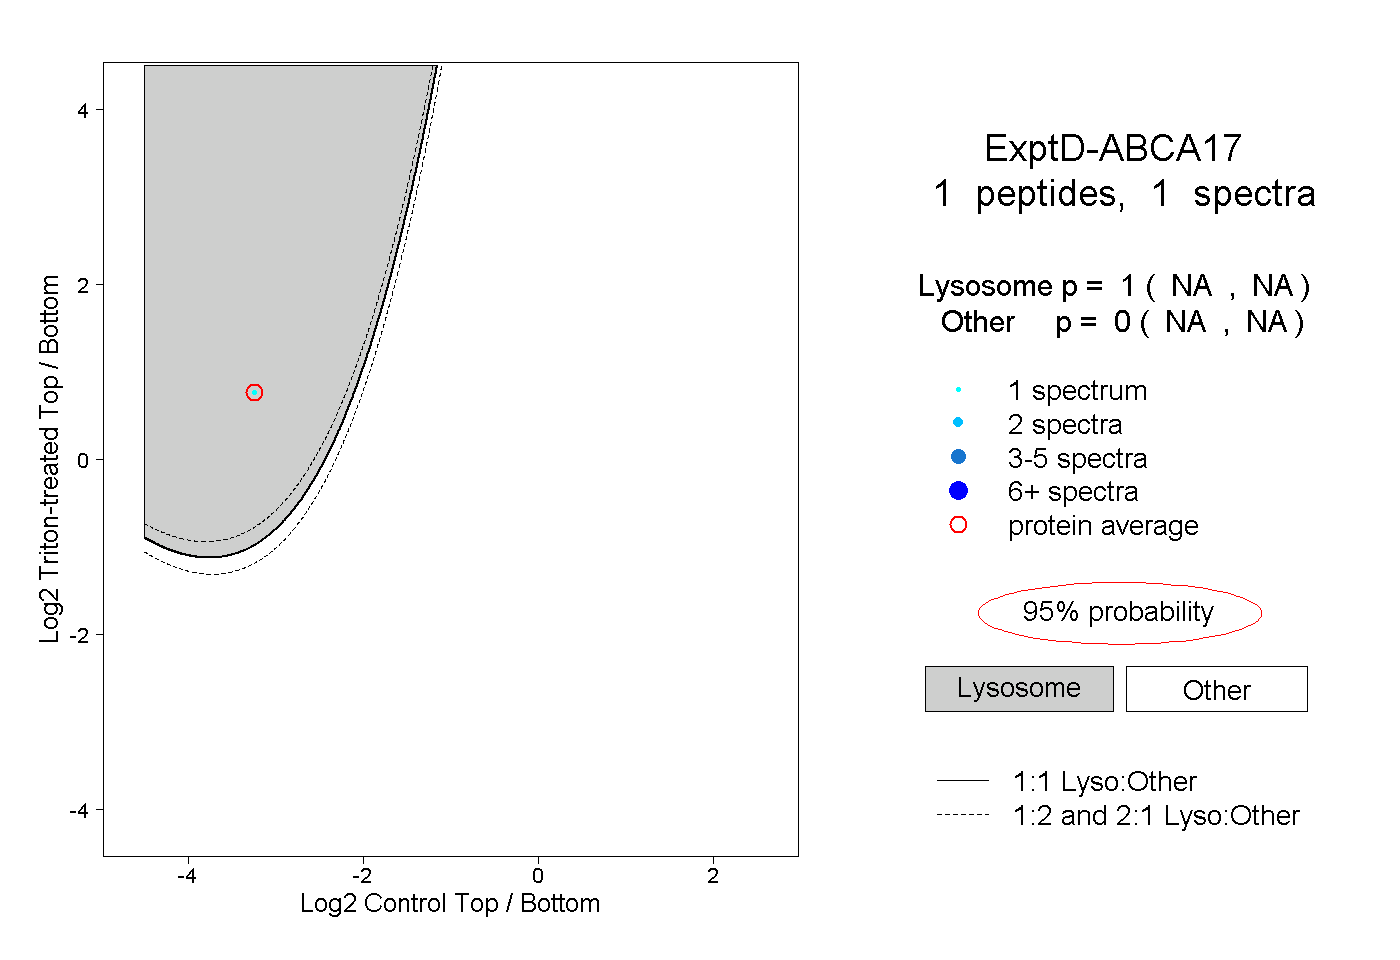 |
1.000 NA | NA |
0.000 NA | NA |