 4
4peptides
spectra
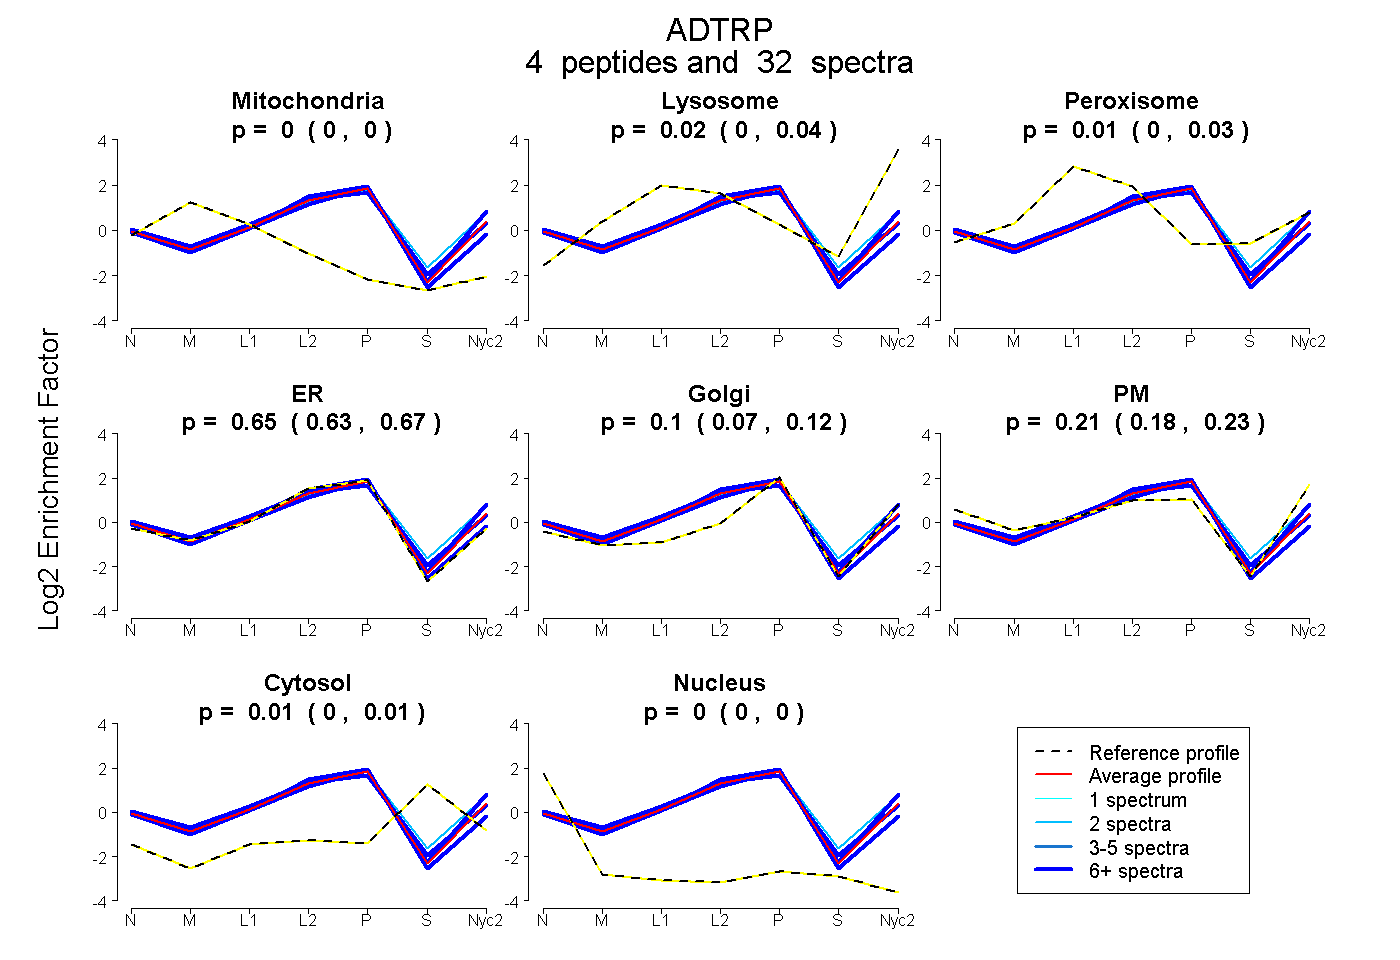
0.000 | 0.000
0.001 | 0.038
0.000 | 0.035
0.629 | 0.673
0.071 | 0.124
0.181 | 0.225
0.000 | 0.011
0.000 | 0.000
3peptides
spectra
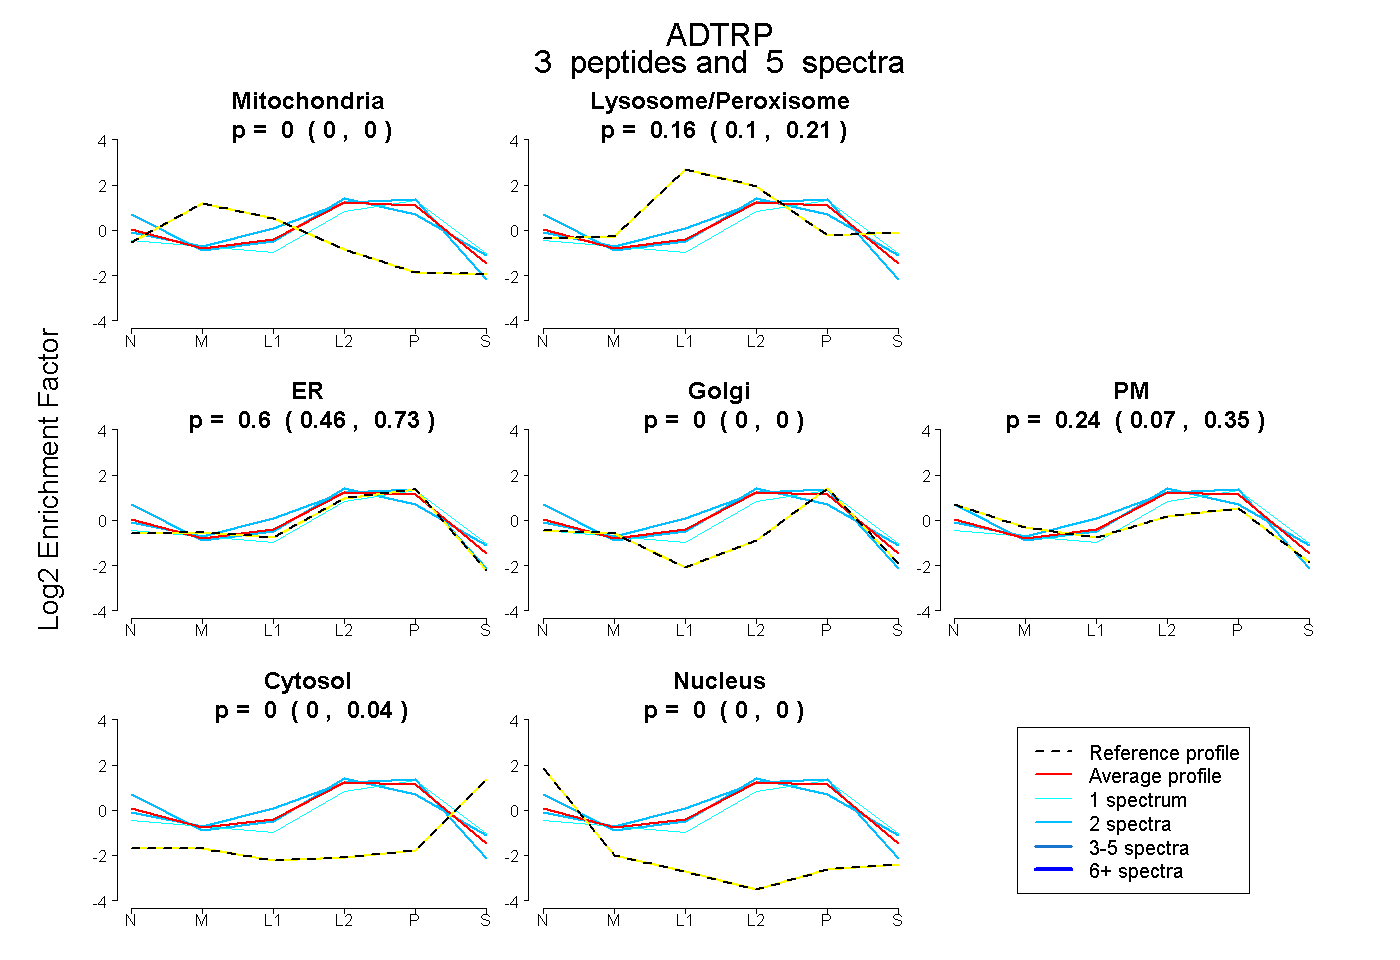
0.000 | 0.000
0.097 | 0.205
0.458 | 0.728
0.000 | 0.000
0.070 | 0.353
0.000 | 0.036
0.000 | 0.000
4peptides
spectra
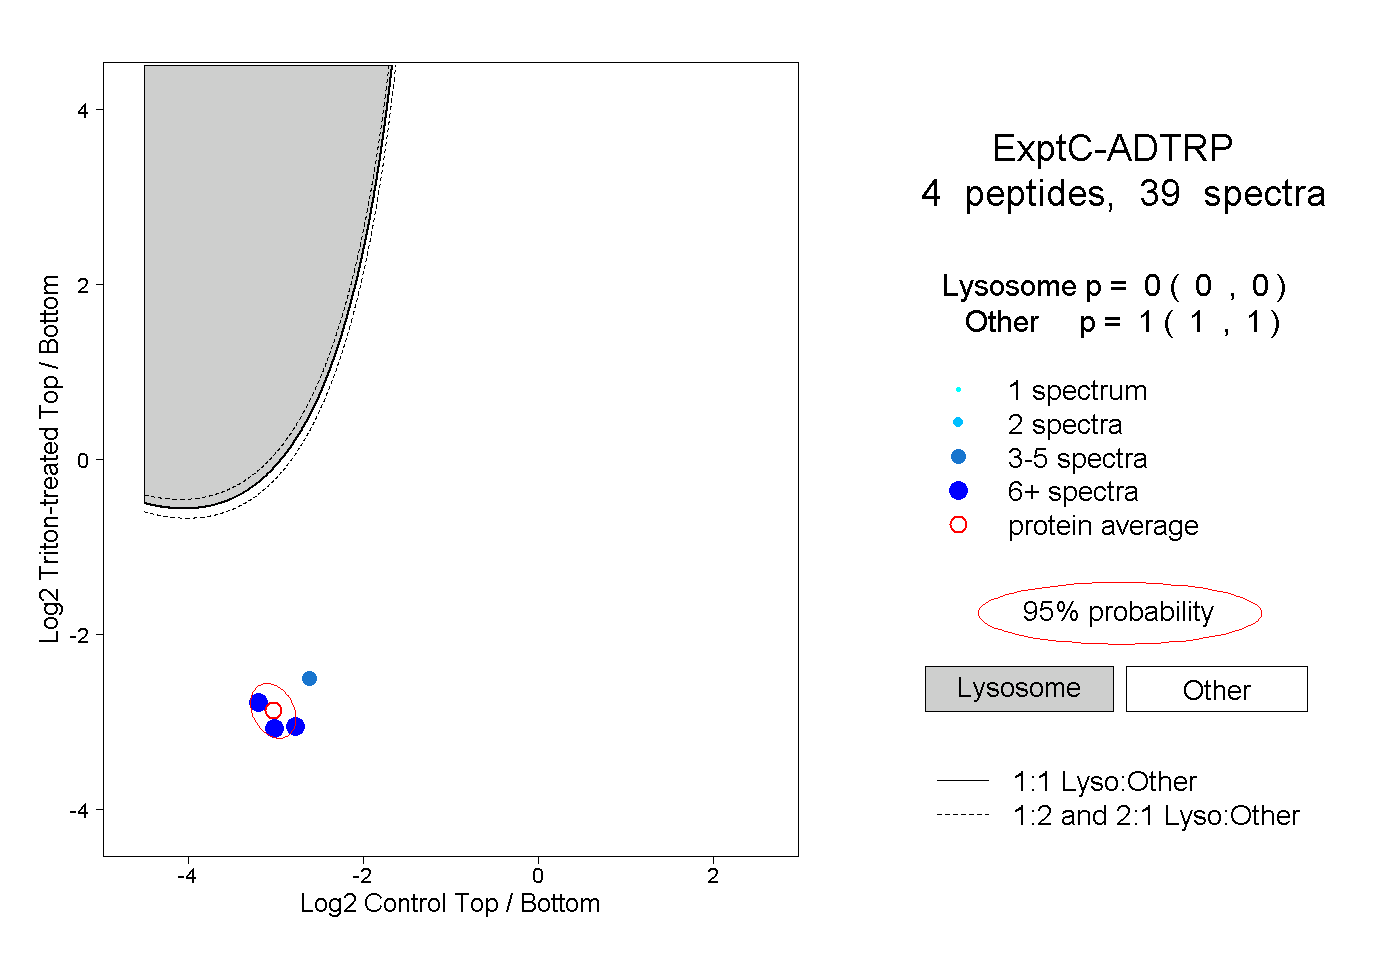
0.000 | 0.000
1.000 | 1.000
2peptides
spectra
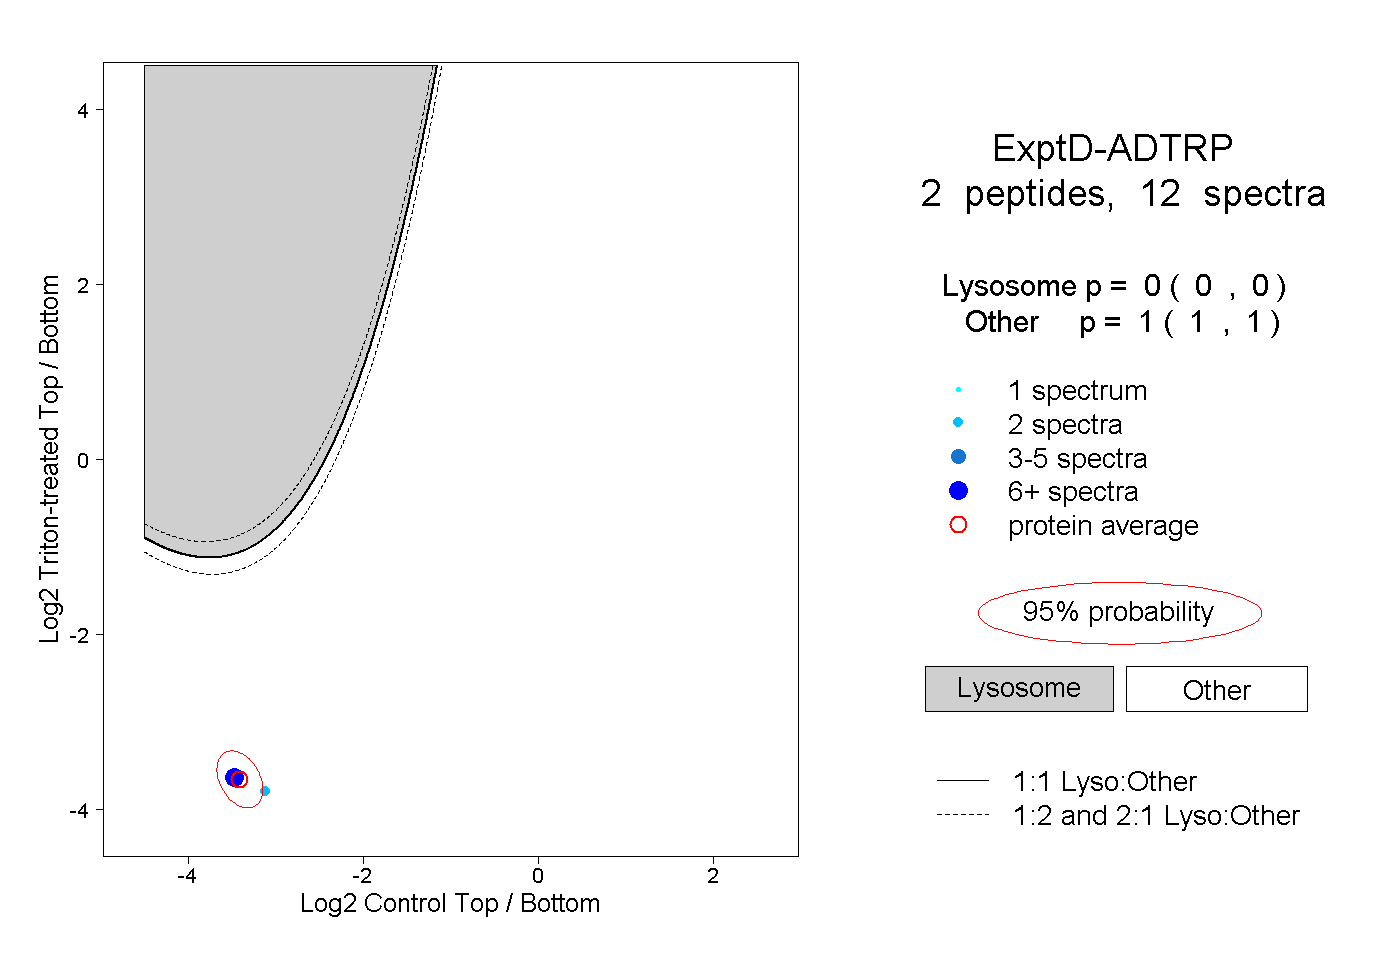
0.000 | 0.000
1.000 | 1.000