 3
3peptides
spectra
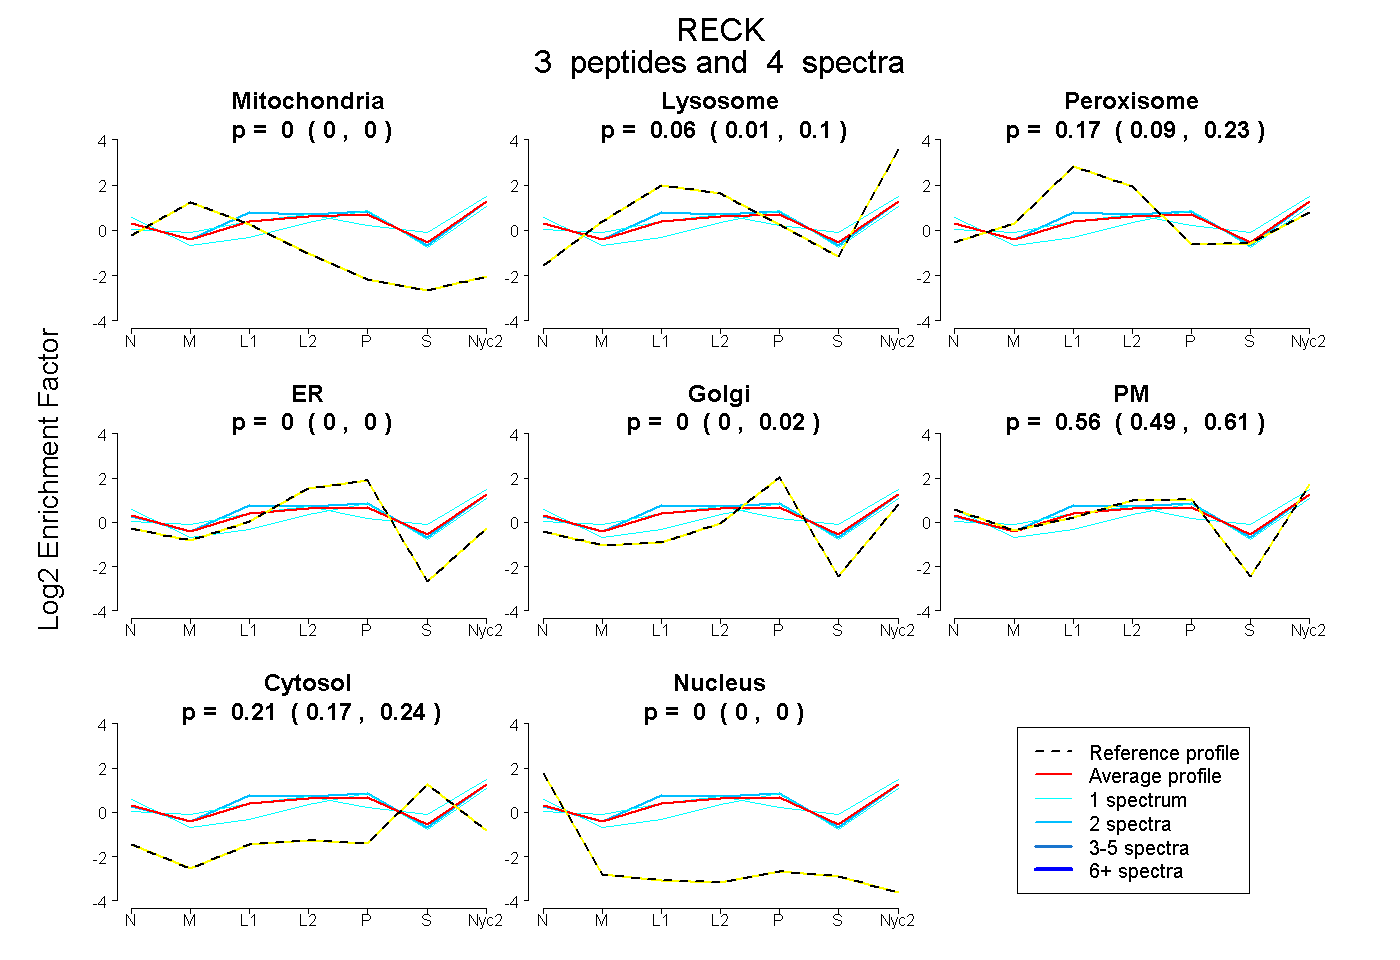
0.000 | 0.000
0.013 | 0.096
0.086 | 0.234
0.000 | 0.000
0.000 | 0.019
0.495 | 0.613
0.171 | 0.235
0.000 | 0.000
4peptides
spectra
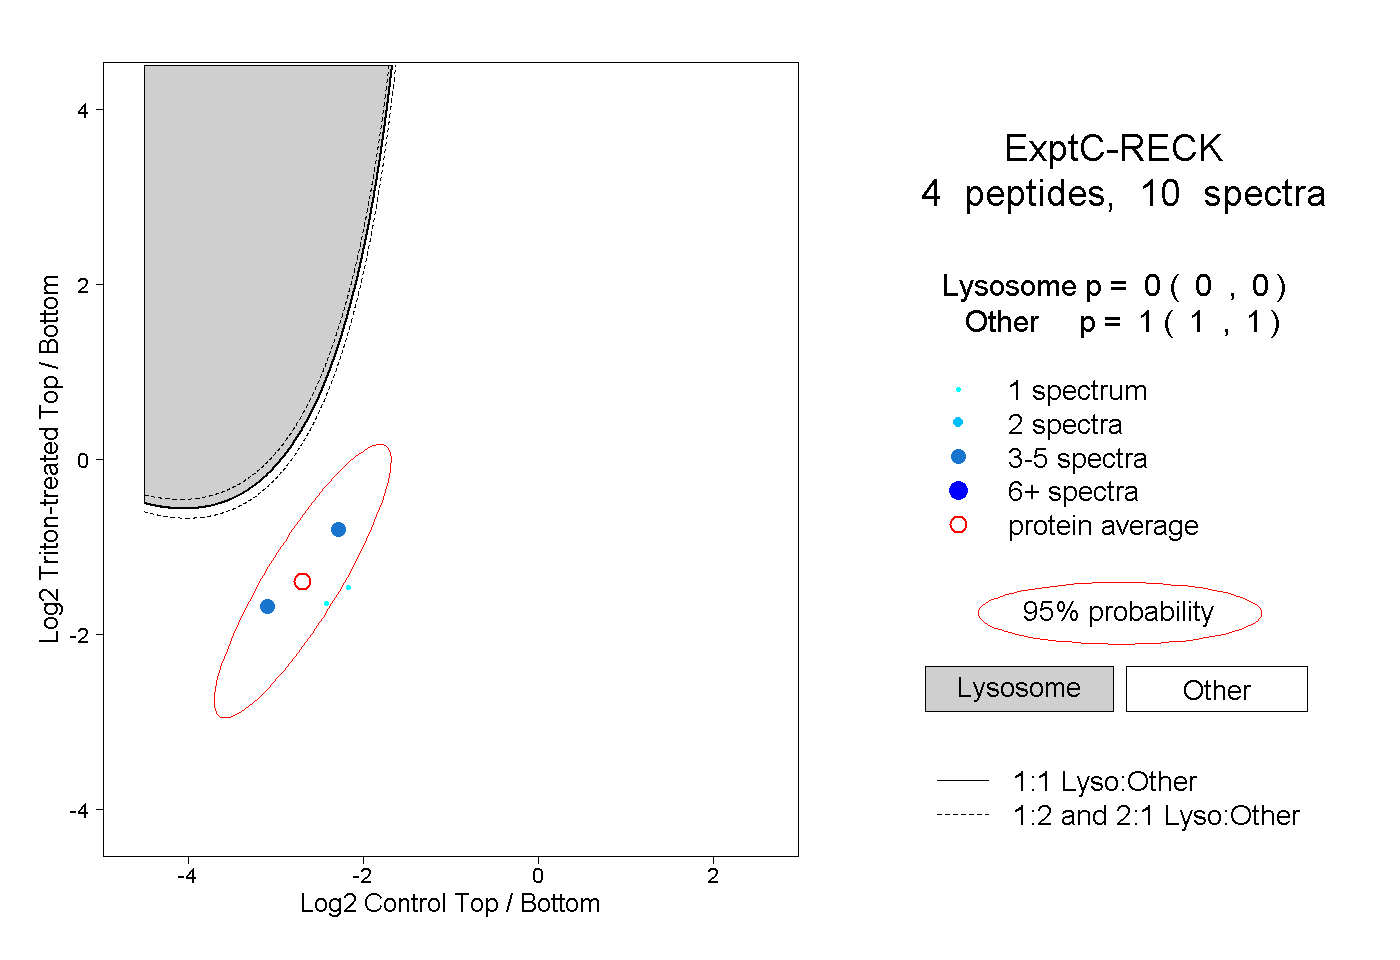
0.000 | 0.000
1.000 | 1.000
| Plot | Mito | Lyso | Perox | ER | Golgi | PM | Cytosol | Nucleus | |||||
| Expt A |
3 peptides |
4 spectra |
|
0.000 0.000 | 0.000 |
0.059 0.013 | 0.096 |
0.170 0.086 | 0.234 |
0.000 0.000 | 0.000 |
0.000 0.000 | 0.019 |
0.563 0.495 | 0.613 |
0.207 0.171 | 0.235 |
0.000 0.000 | 0.000 |
||
| Plot | Lyso | Other | |||||||||||
| Expt C |
4 peptides |
10 spectra |
|
0.000 0.000 | 0.000 |
1.000 1.000 | 1.000 |