 4
4peptides
spectra
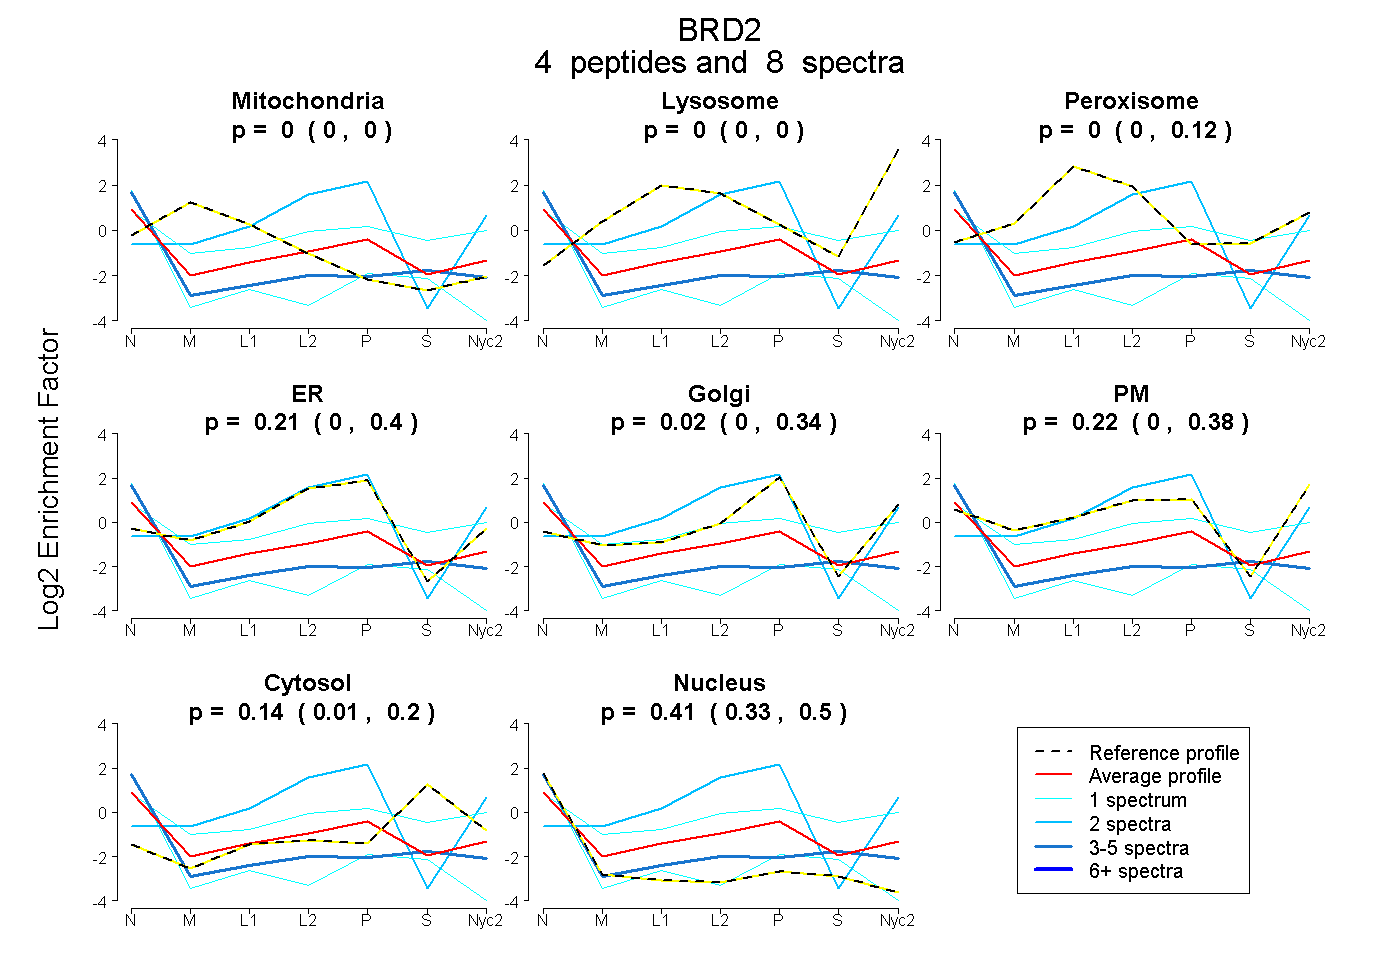
0.000 | 0.000
0.000 | 0.000
0.000 | 0.118
0.000 | 0.401
0.000 | 0.344
0.000 | 0.381
0.009 | 0.199
0.334 | 0.500
1peptide
spectrum
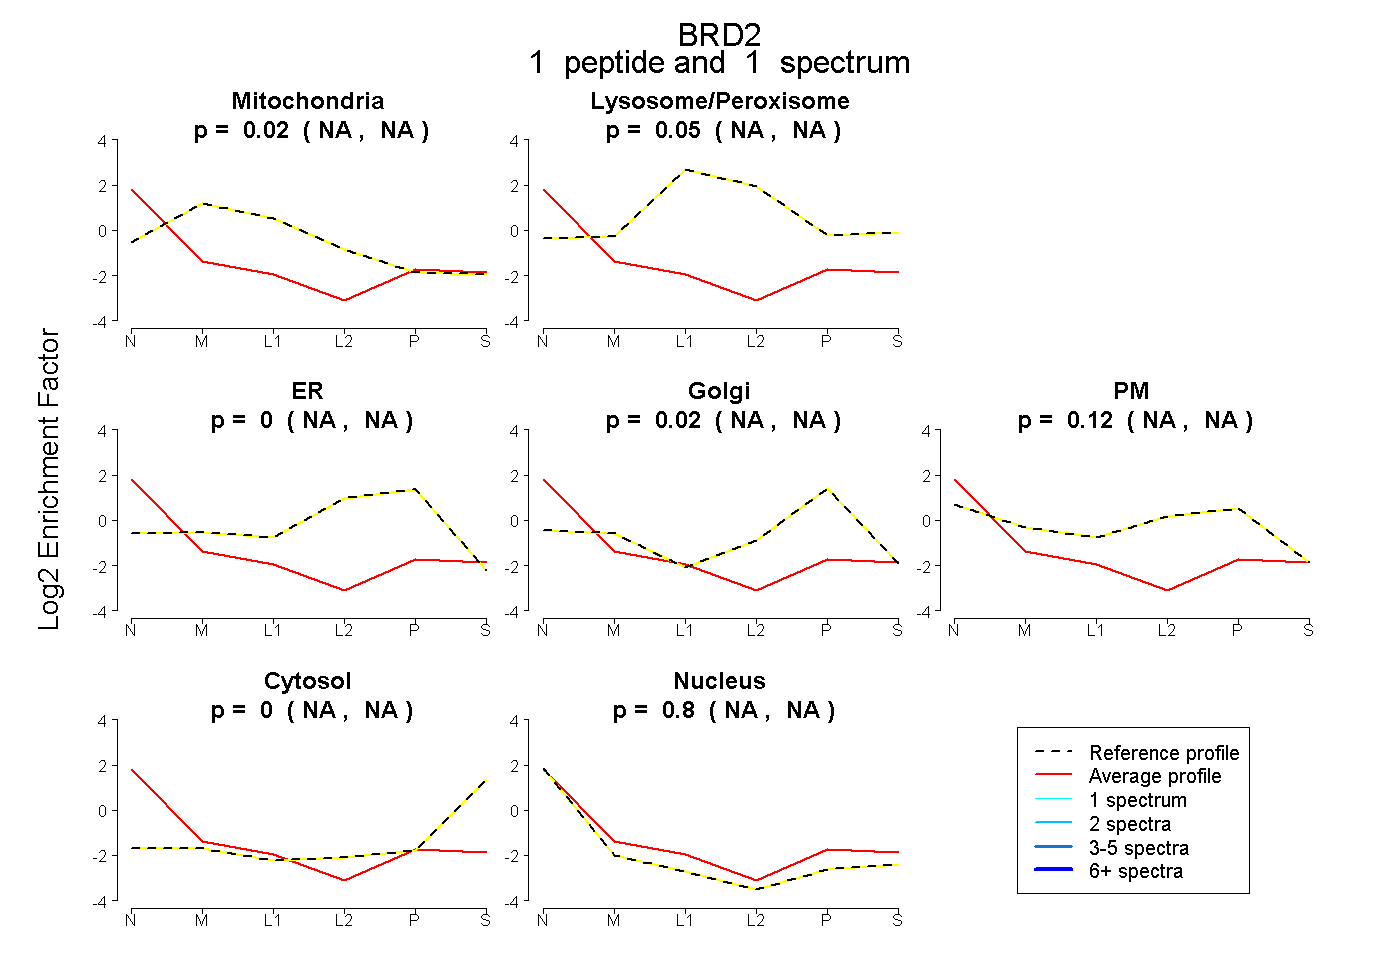
NA | NA
NA | NA
NA | NA
NA | NA
NA | NA
NA | NA
NA | NA
1peptide
spectrum
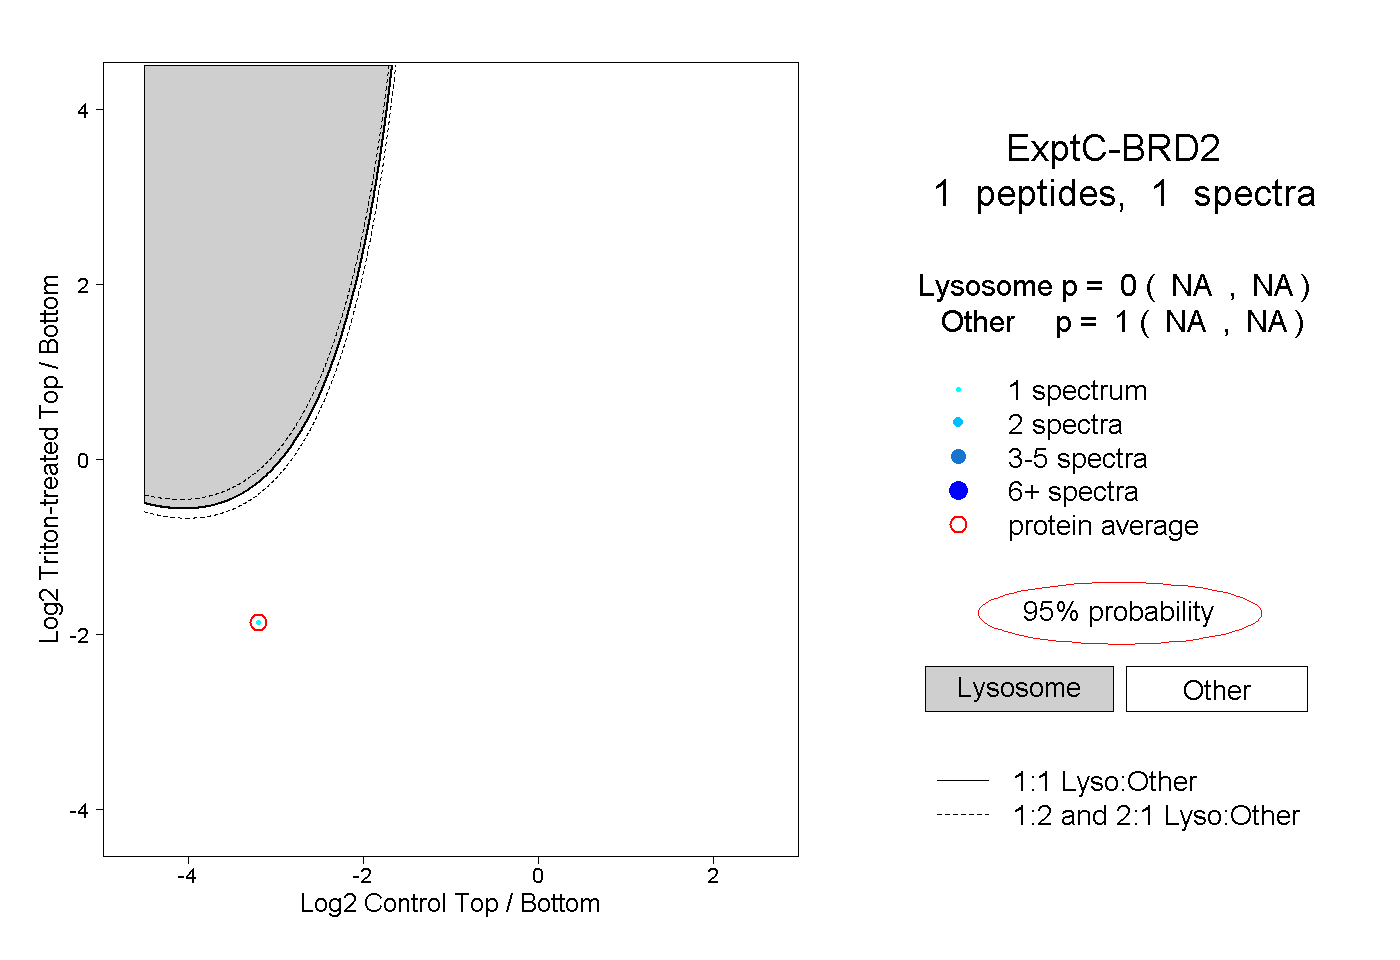
NA | NA
NA | NA