 2
2peptides
spectra

0.000 | 0.000
0.000 | 0.000
0.000 | 0.000
0.000 | 0.134
0.000 | 0.187
0.000 | 0.000
0.763 | 0.803
0.016 | 0.075
2peptides
spectra
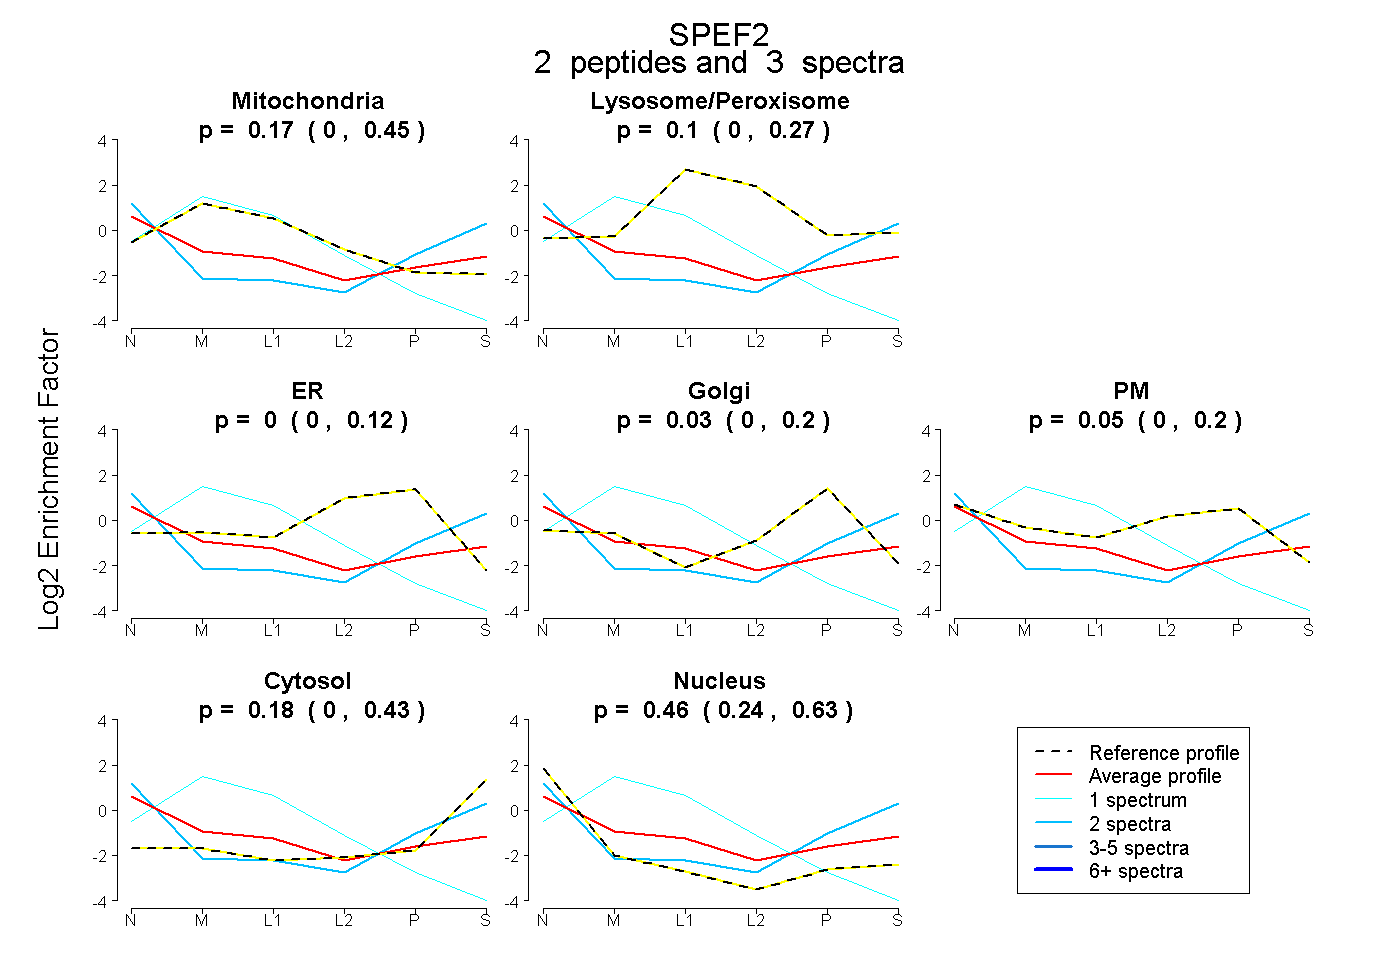
0.000 | 0.452
0.000 | 0.267
0.000 | 0.118
0.000 | 0.196
0.000 | 0.195
0.000 | 0.433
0.238 | 0.634
2peptides
spectra
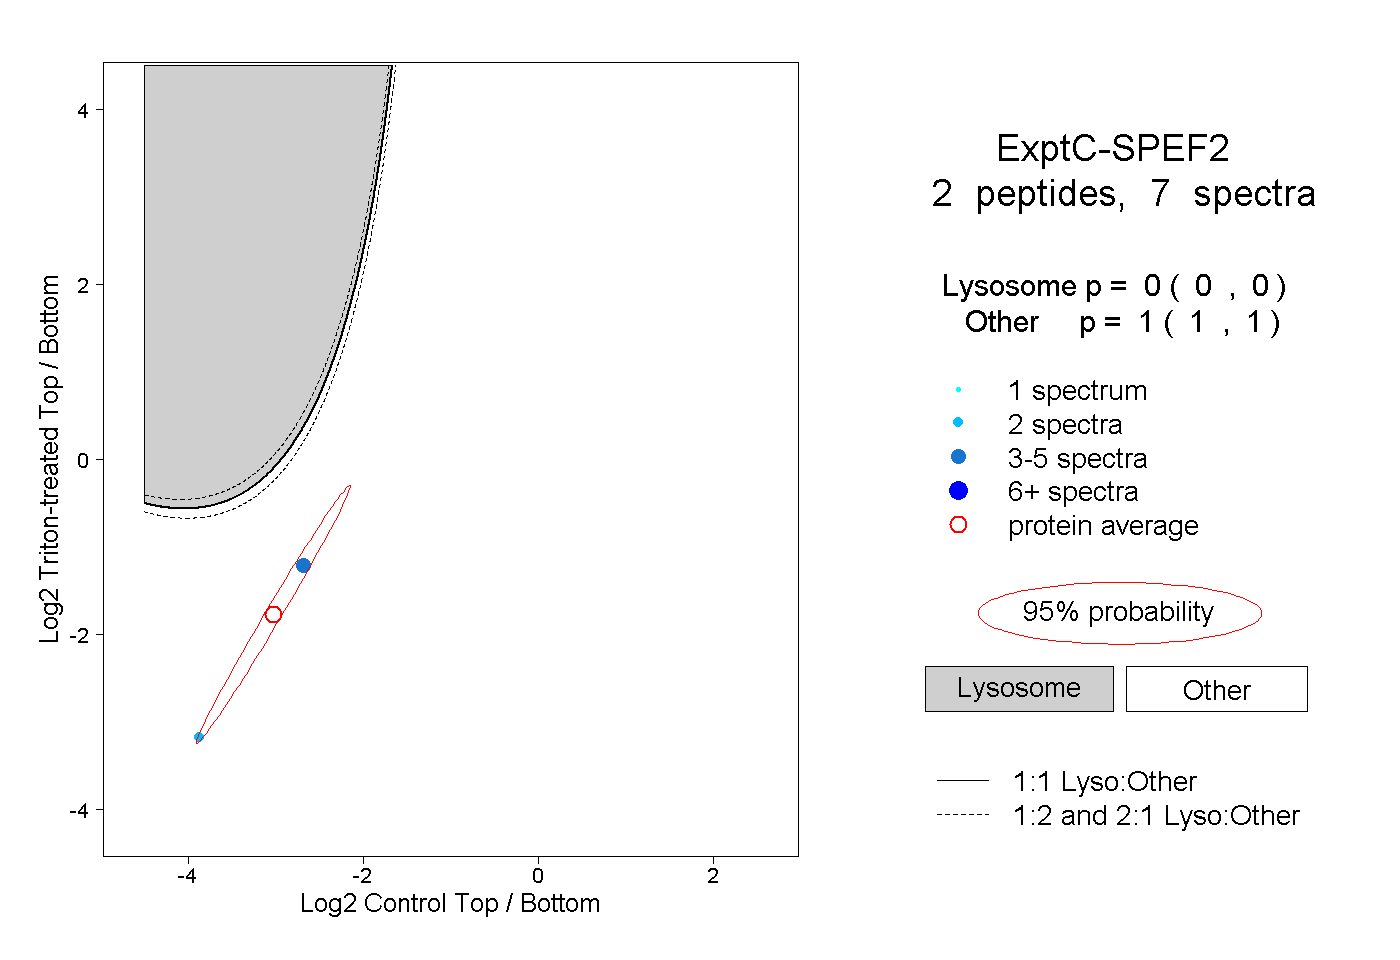
0.000 | 0.000
1.000 | 1.000