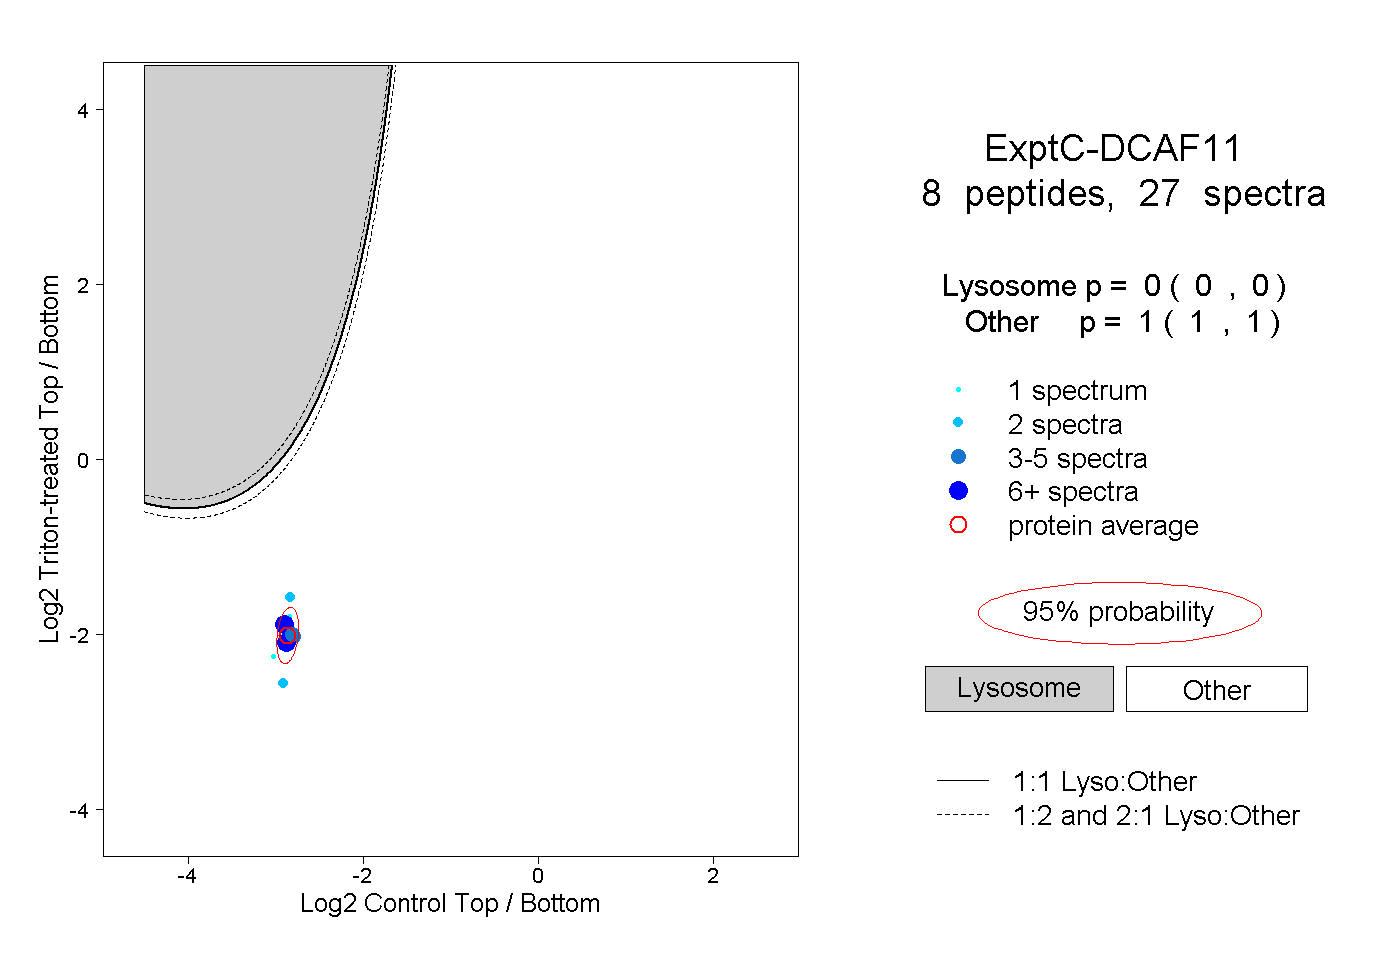
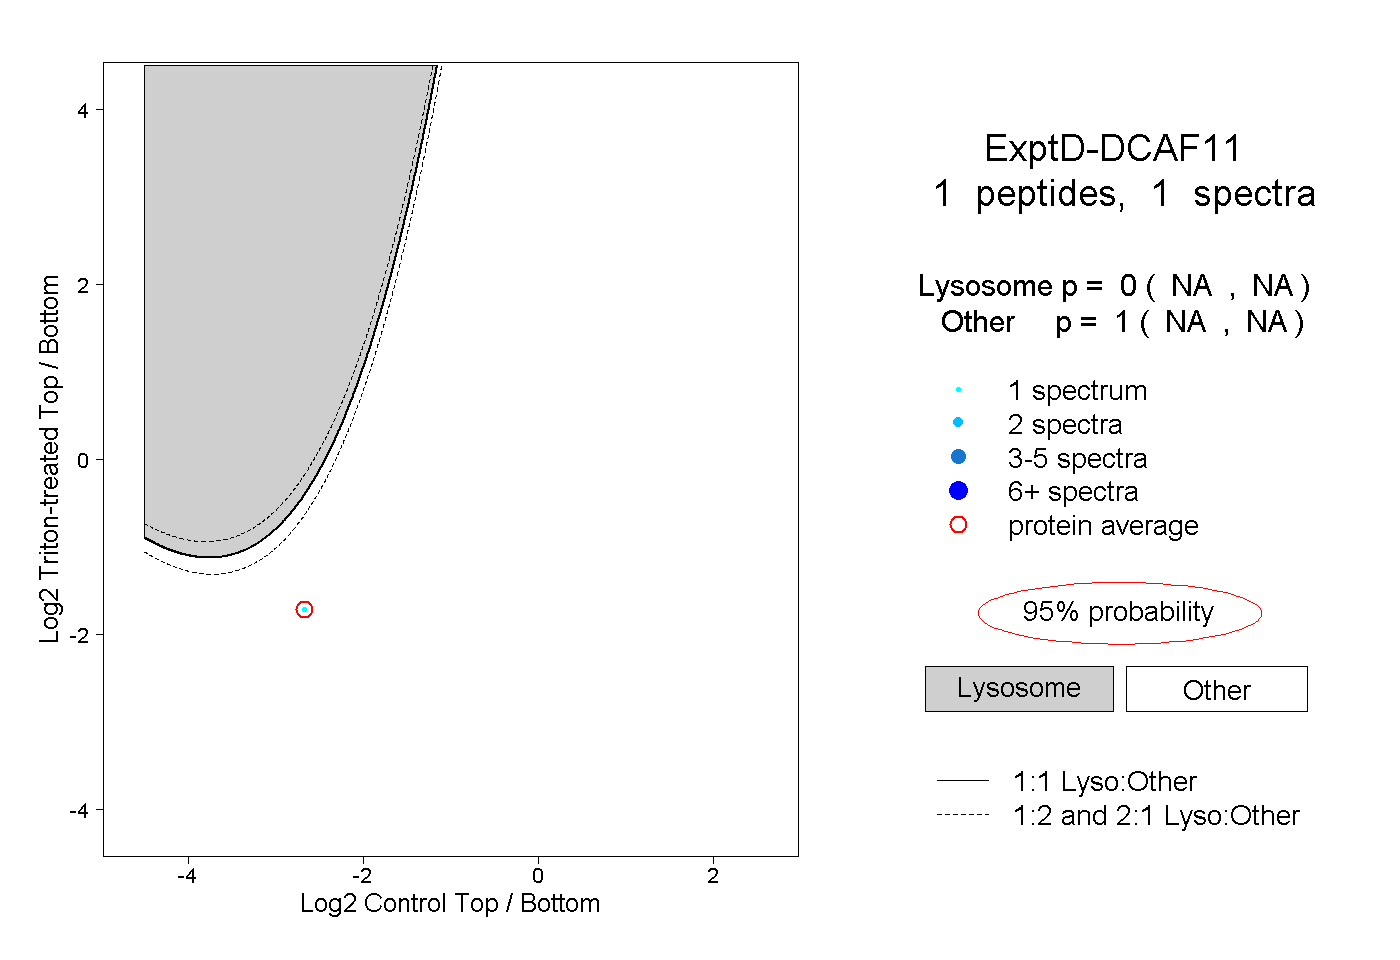
DCAF11
[ENSRNOP00000056736]
Main page
| | | Plot |
Mito |
Lyso |
|
Perox |
ER |
Golgi |
PM |
Cytosol |
Nucleus |
|
| Expt A |
 13
13
peptides |
29
spectra |
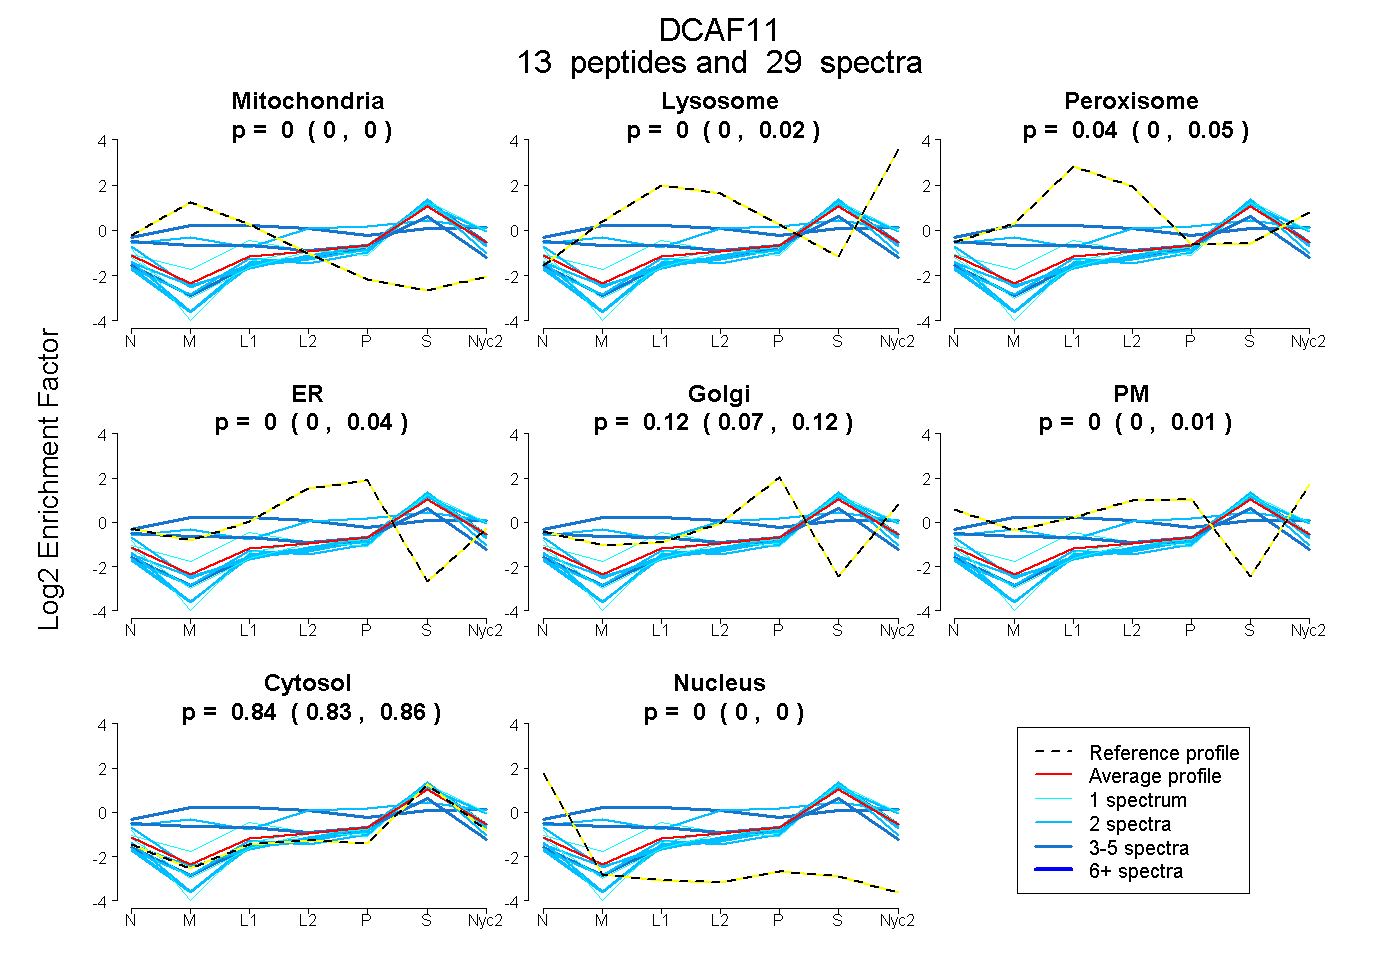 |
0.000
0.000 | 0.000 |
0.000
0.000 | 0.015 |
|
0.038
0.004 | 0.048 |
0.000
0.000 | 0.035 |
0.118
0.072 | 0.123 |
0.000
0.000 | 0.010 |
0.844
0.832 | 0.857 |
0.000
0.000 | 0.000 |
|
| | | Plot |
Mito |
|
Lyso or Perox |
|
ER |
Golgi |
PM |
Cytosol |
Nucleus |
|
| Expt B |
4
peptides |
9
spectra |
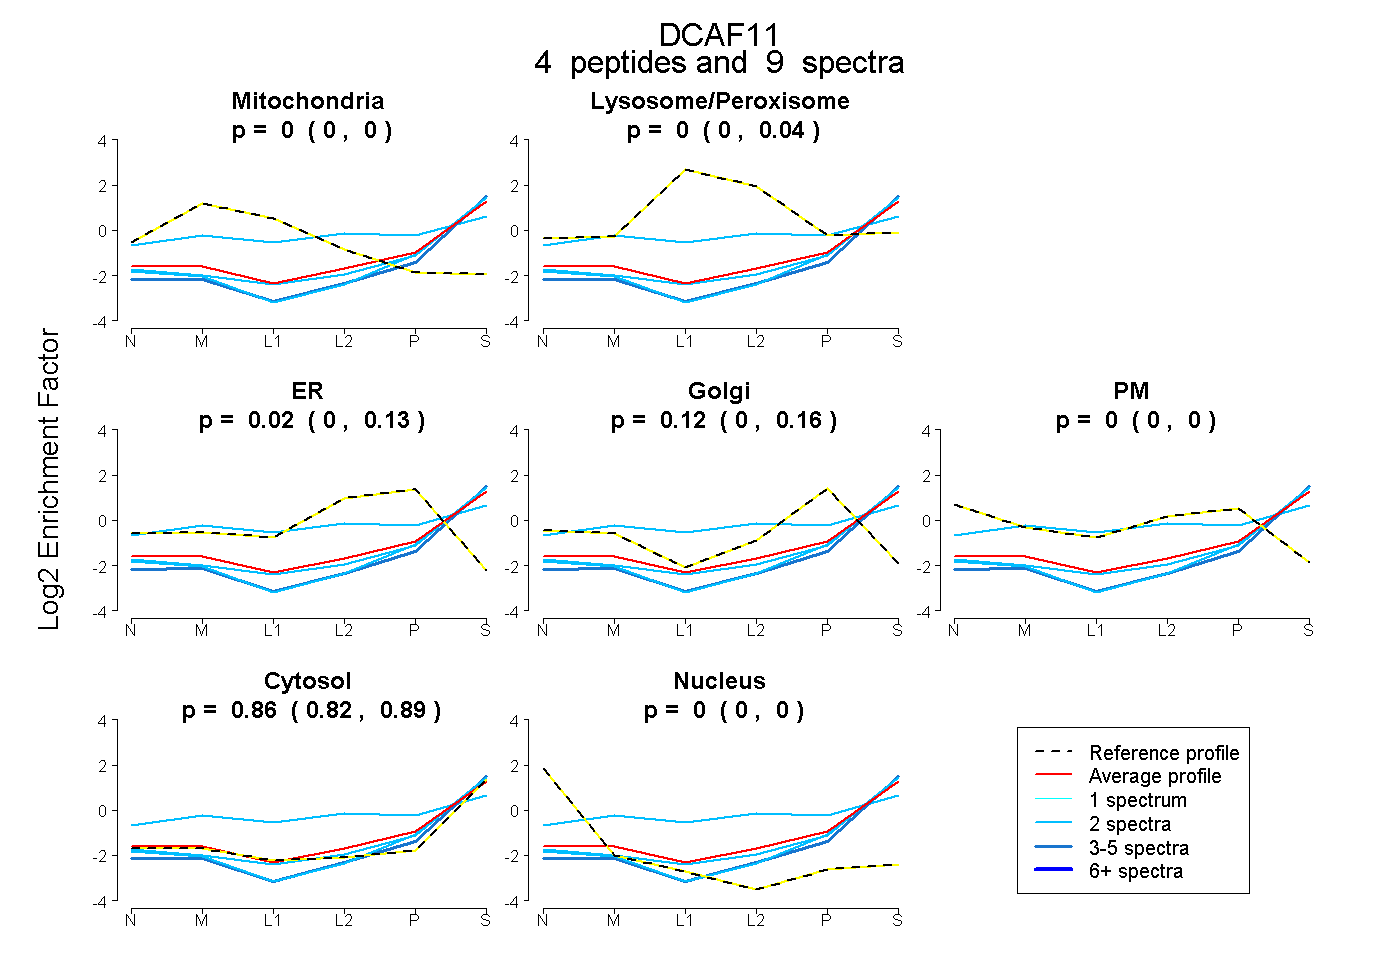 |
0.000
0.000 | 0.000 |
|
0.000
0.000 | 0.036 |
|
0.021
0.000 | 0.130 |
0.118
0.000 | 0.160 |
0.000
0.000 | 0.000 |
0.861
0.822 | 0.889 |
0.000
0.000 | 0.000 |
|
| | | Plot |
|
Lyso |
|
|
|
|
|
|
|
Other |
| Expt C |
8
peptides |
27
spectra |
 |
|
0.000
0.000 | 0.000 |
|
|
|
|
|
|
|
1.000
1.000 | 1.000 |
| 6 spectra, YLISNSK |
|
0.000 |
|
|
|
|
|
|
|
1.000 |
| 5 spectra, YNPPVDATPDTR |
|
0.000 |
|
|
|
|
|
|
|
1.000 |
| 1 spectrum, LPGDSSLMTYR |
|
0.000 |
|
|
|
|
|
|
|
1.000 |
| 2 spectra, GSFSLGEQSR |
|
0.000 |
|
|
|
|
|
|
|
1.000 |
| 2 spectra, ELEYNEIK |
|
0.000 |
|
|
|
|
|
|
|
1.000 |
| 6 spectra, VELATGR |
|
0.000 |
|
|
|
|
|
|
|
1.000 |
| 1 spectrum, LAATQQNWDYR |
|
0.000 |
|
|
|
|
|
|
|
1.000 |
| 4 spectra, TAQEHSFPR |
|
0.000 |
|
|
|
|
|
|
|
1.000 |
| | | Plot |
|
Lyso |
|
|
|
|
|
|
|
Other |
| Expt D |
1
peptide |
1
spectrum |
 |
|
0.000
NA | NA |
|
|
|
|
|
|
|
1.000
NA | NA |