 1
1peptide
spectrum
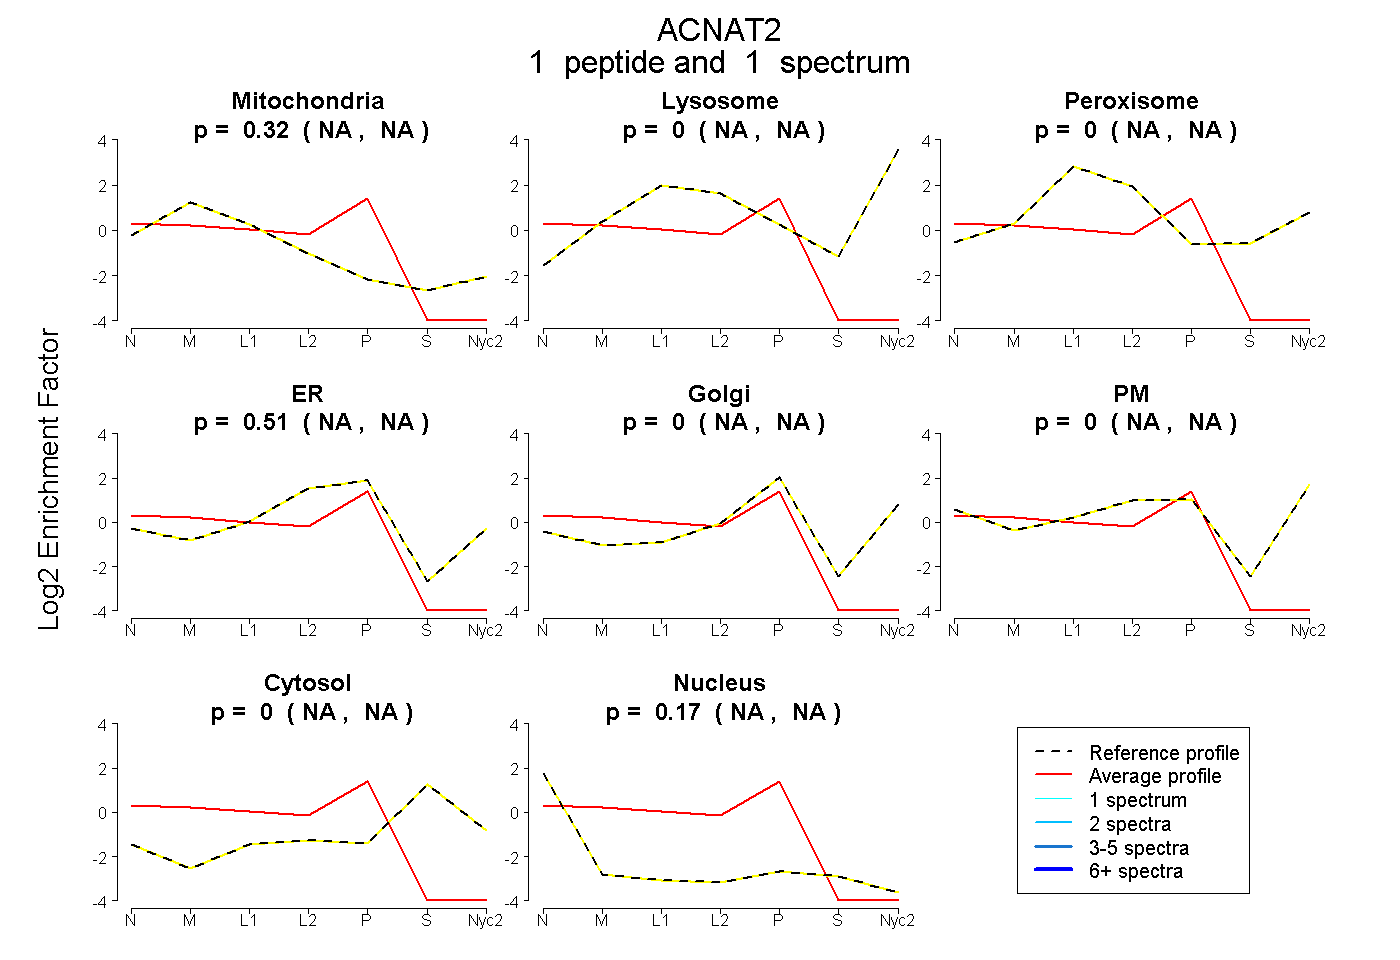
NA | NA
NA | NA
NA | NA
NA | NA
NA | NA
NA | NA
NA | NA
NA | NA
9peptides
spectra
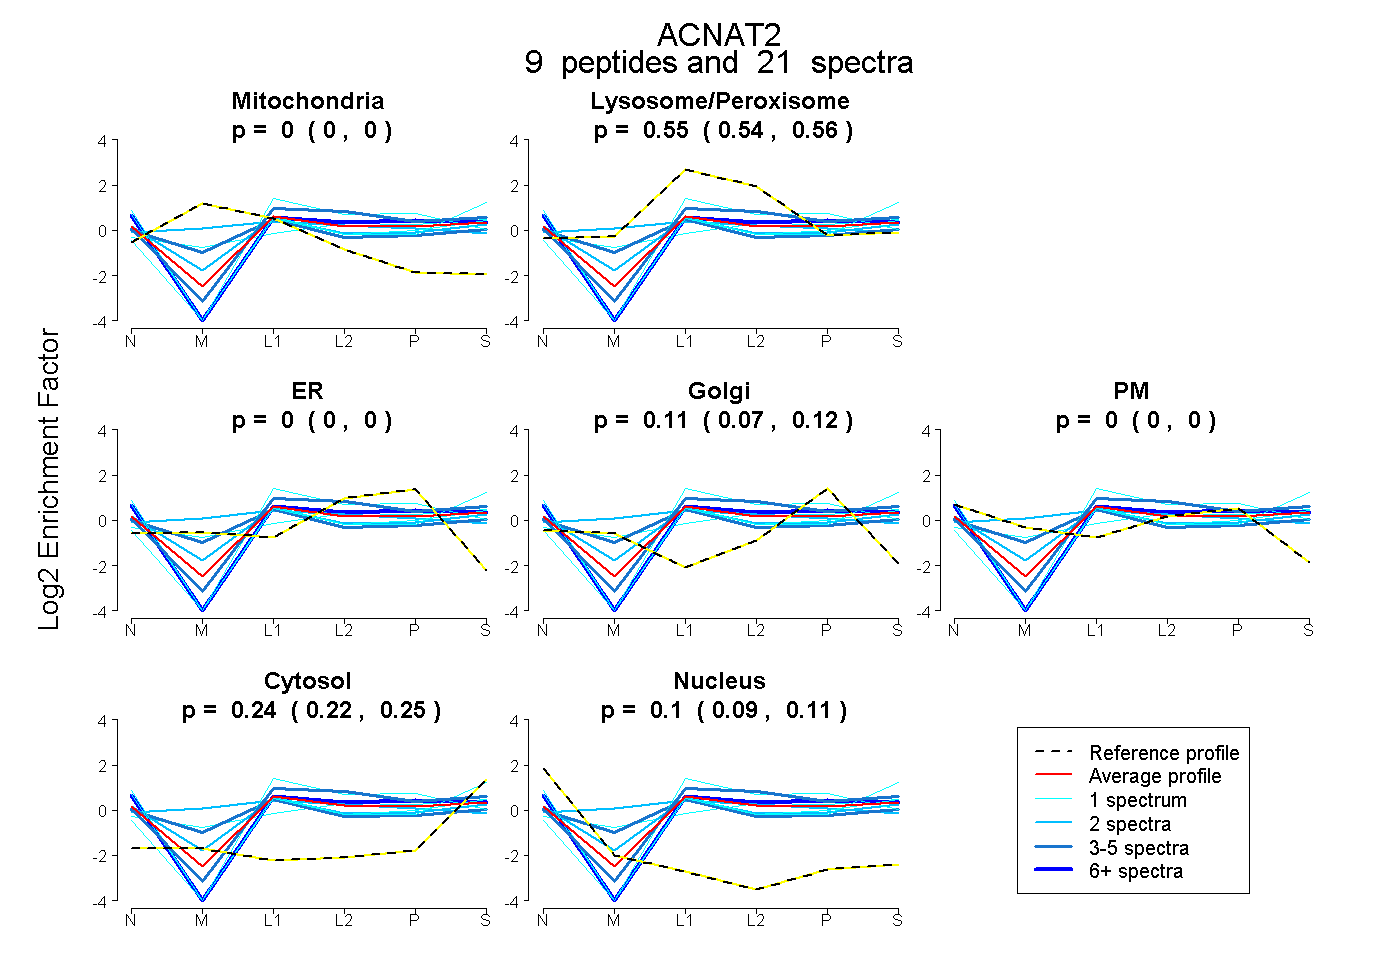
0.000 | 0.000
0.538 | 0.561
0.000 | 0.000
0.072 | 0.124
0.000 | 0.000
0.224 | 0.251
0.087 | 0.113
16peptides
spectra
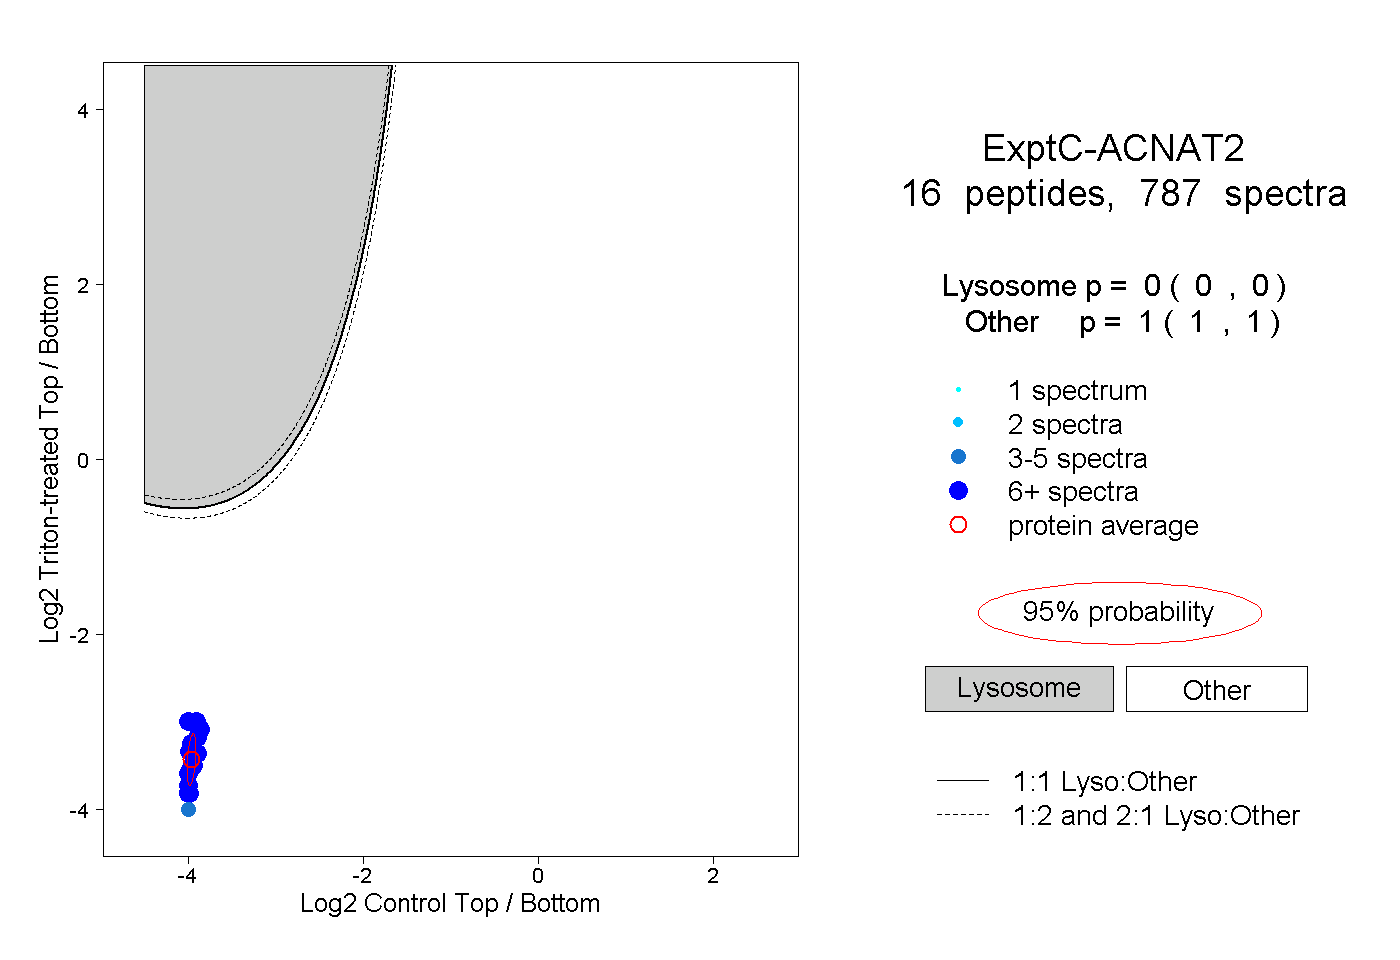
0.000 | 0.000
1.000 | 1.000
11peptides
spectra
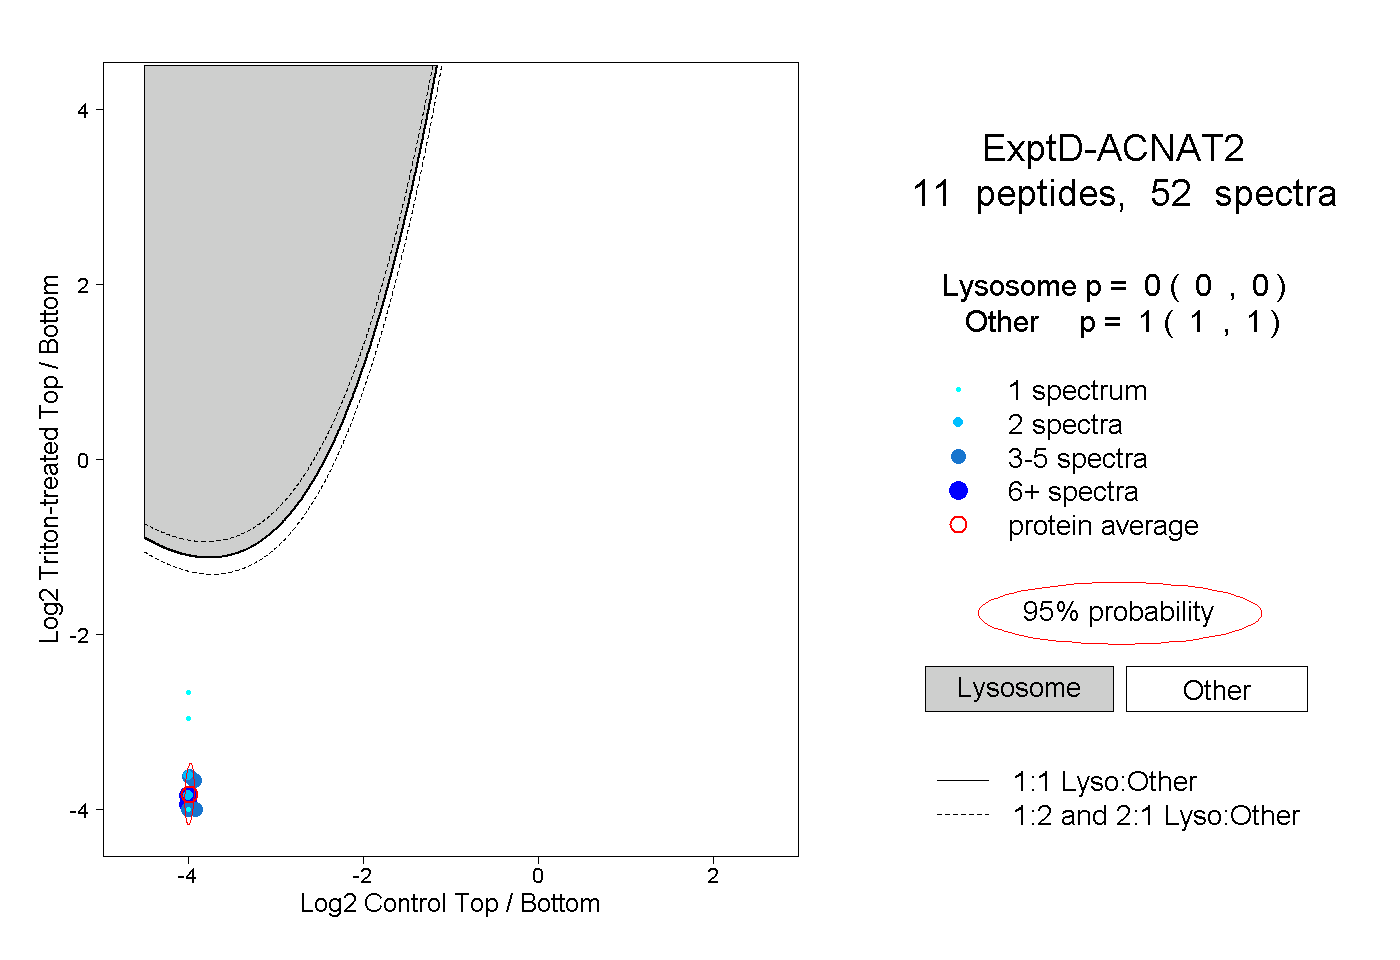
0.000 | 0.000
1.000 | 1.000