 1
1peptide
spectrum
NA | NA
NA | NA
NA | NA
NA | NA
NA | NA
NA | NA
NA | NA
NA | NA
9peptides
spectra
0.000 | 0.000
0.538 | 0.561
0.000 | 0.000
0.072 | 0.124
0.000 | 0.000
0.224 | 0.251
0.087 | 0.113
| Plot | Mito | Lyso | Perox | ER | Golgi | PM | Cytosol | Nucleus | |||||
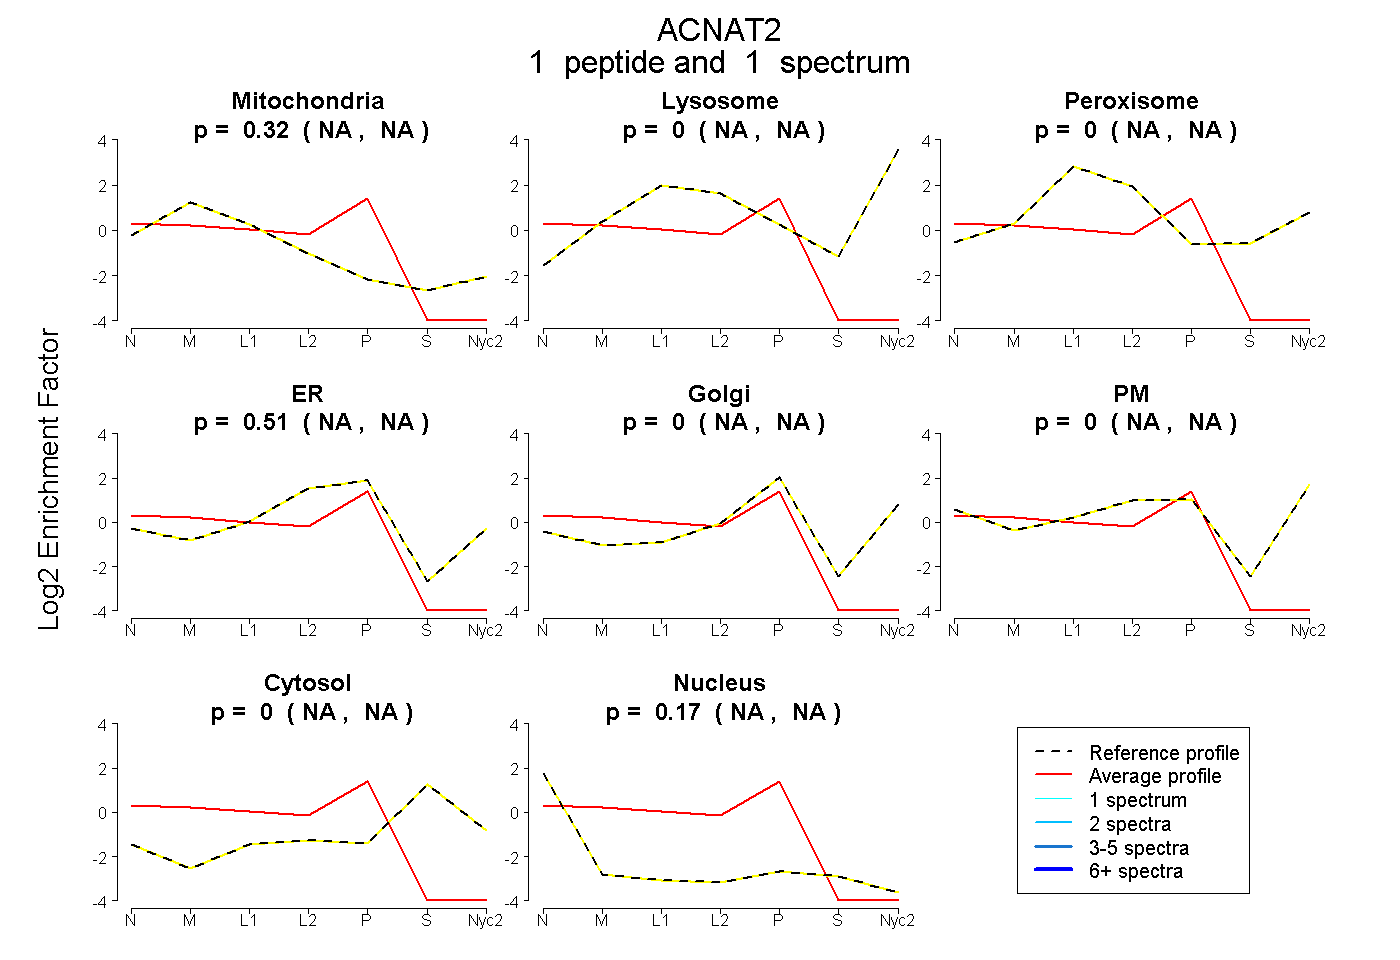
| Expt A |
1 peptide |
1 spectrum |
|
0.317 NA | NA |
0.000 NA | NA |
0.000 NA | NA |
0.512 NA | NA |
0.000 NA | NA |
0.000 NA | NA |
0.000 NA | NA |
0.171 NA | NA |
||
| Plot | Mito | Lyso or Perox | ER | Golgi | PM | Cytosol | Nucleus | ||||||
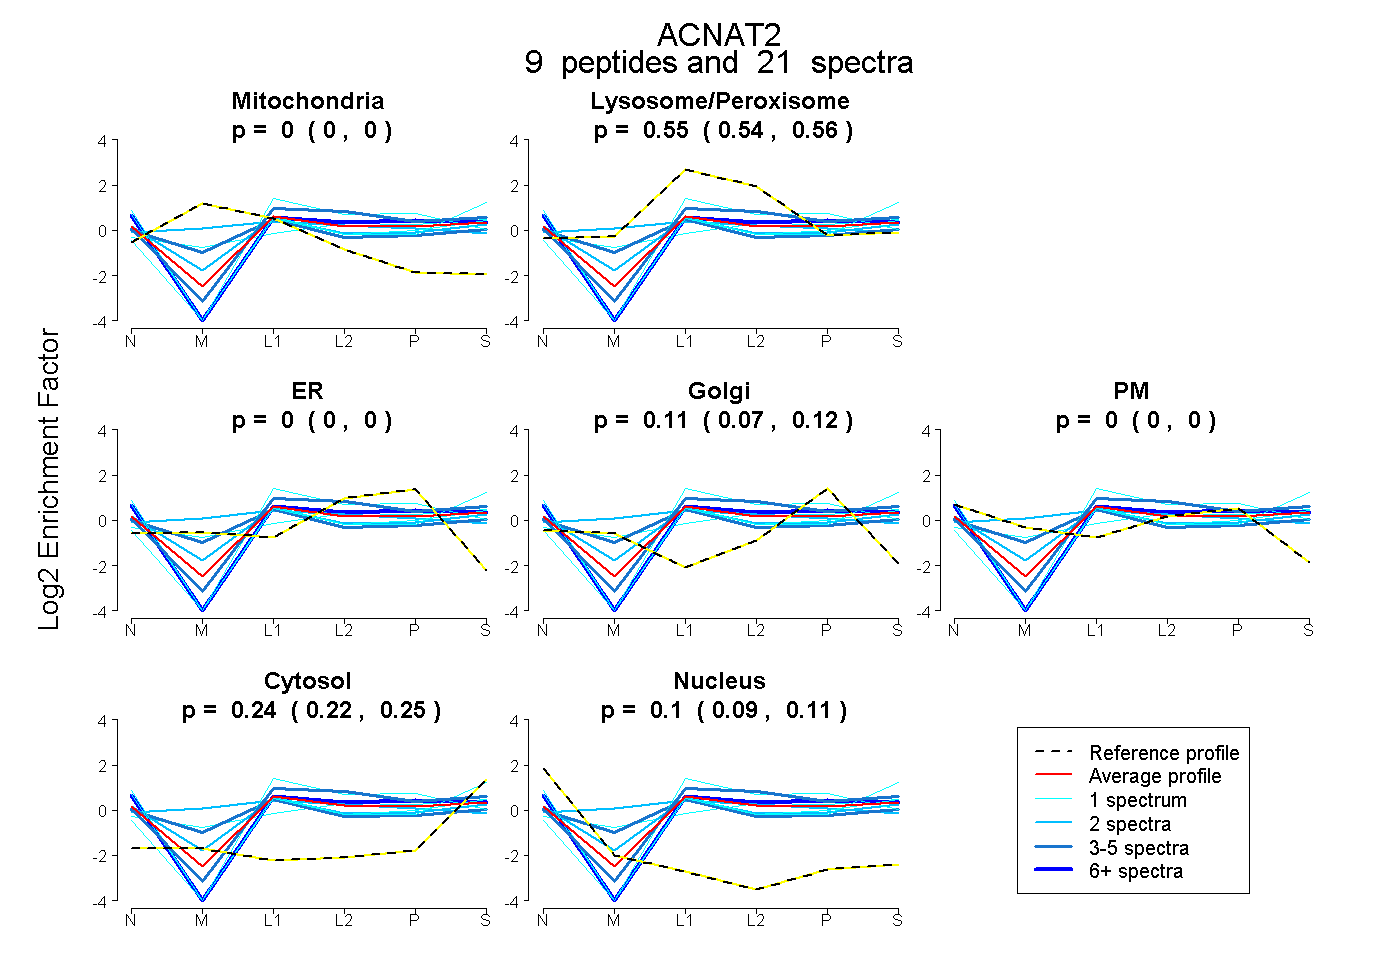
| Expt B |
9 peptides |
21 spectra |
|
0.000 0.000 | 0.000 |
0.552 0.538 | 0.561 |
0.000 0.000 | 0.000 |
0.109 0.072 | 0.124 |
0.000 0.000 | 0.000 |
0.238 0.224 | 0.251 |
0.101 0.087 | 0.113 |
| 4 spectra, WFAGPGVK | 0.000 | 0.594 | 0.099 | 0.000 | 0.000 | 0.277 | 0.030 | |||
| 1 spectrum, IQQPGIGVISVSK | 0.000 | 0.647 | 0.098 | 0.000 | 0.000 | 0.083 | 0.172 | |||
| 3 spectra, GALFLPPGK | 0.000 | 0.522 | 0.000 | 0.142 | 0.000 | 0.209 | 0.127 | |||
| 1 spectrum, ILFIVGENDQCLASK | 0.000 | 0.456 | 0.000 | 0.000 | 0.000 | 0.540 | 0.003 | |||
| 1 spectrum, AIGLPPSQIVTITATVK | 0.000 | 0.454 | 0.000 | 0.247 | 0.025 | 0.274 | 0.000 | |||
| 2 spectra, GAEIGLAMACYLK | 0.000 | 0.536 | 0.000 | 0.094 | 0.000 | 0.235 | 0.135 | |||
| 1 spectrum, IQFHGSGAACFR | 0.000 | 0.528 | 0.000 | 0.000 | 0.000 | 0.222 | 0.250 | |||
| 2 spectra, DLVVTPMR | 0.063 | 0.432 | 0.000 | 0.111 | 0.239 | 0.155 | 0.000 | |||
| 6 spectra, ASLLASR | 0.000 | 0.516 | 0.096 | 0.000 | 0.000 | 0.220 | 0.168 |
| Plot | Lyso | Other | |||||||||||
| Expt C |
16 peptides |
787 spectra |
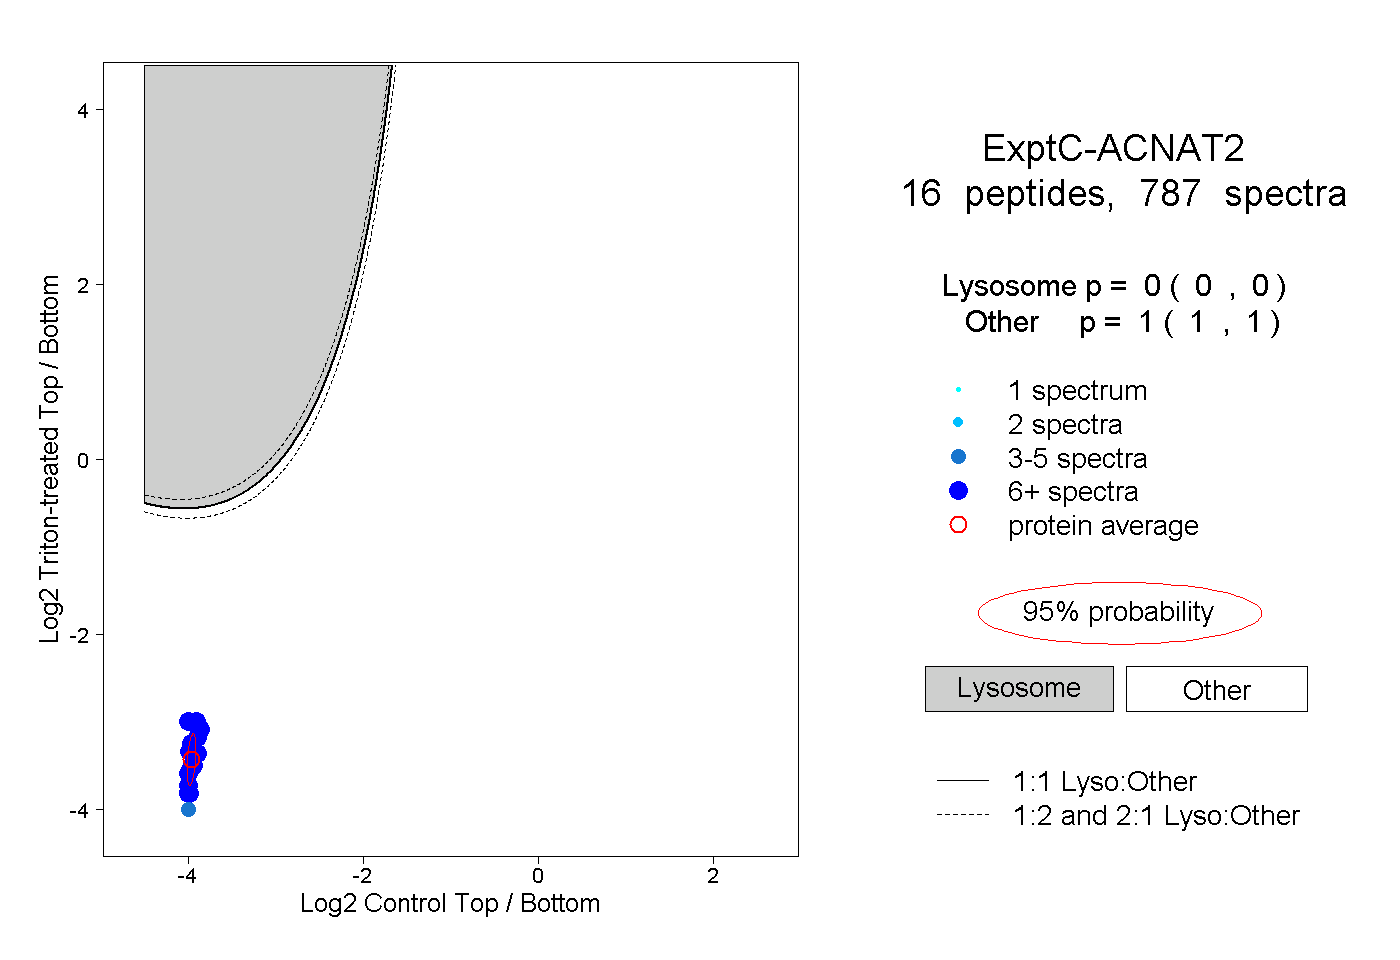 |
0.000 0.000 | 0.000 |
1.000 1.000 | 1.000 |
||||||||
| Plot | Lyso | Other | |||||||||||
| Expt D |
11 peptides |
52 spectra |
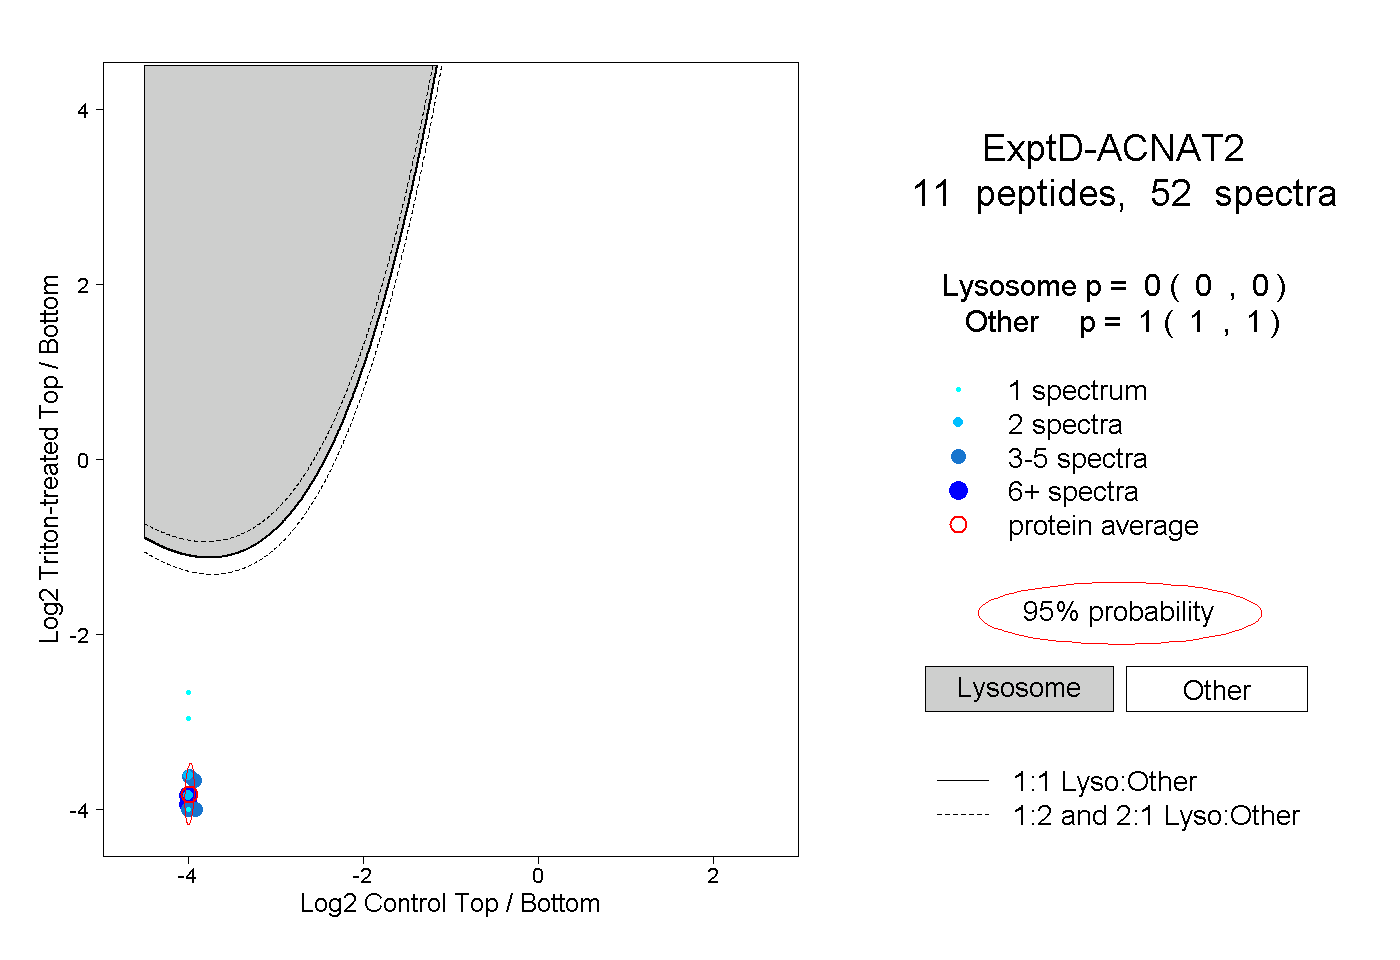 |
0.000 0.000 | 0.000 |
1.000 1.000 | 1.000 |