 10
10peptides
spectra
0.000 | 0.000
0.000 | 0.000
0.000 | 0.000
0.080 | 0.118
0.000 | 0.035
0.612 | 0.651
0.240 | 0.264
0.000 | 0.000
| Plot | Mito | Lyso | Perox | ER | Golgi | PM | Cytosol | Nucleus | |||||
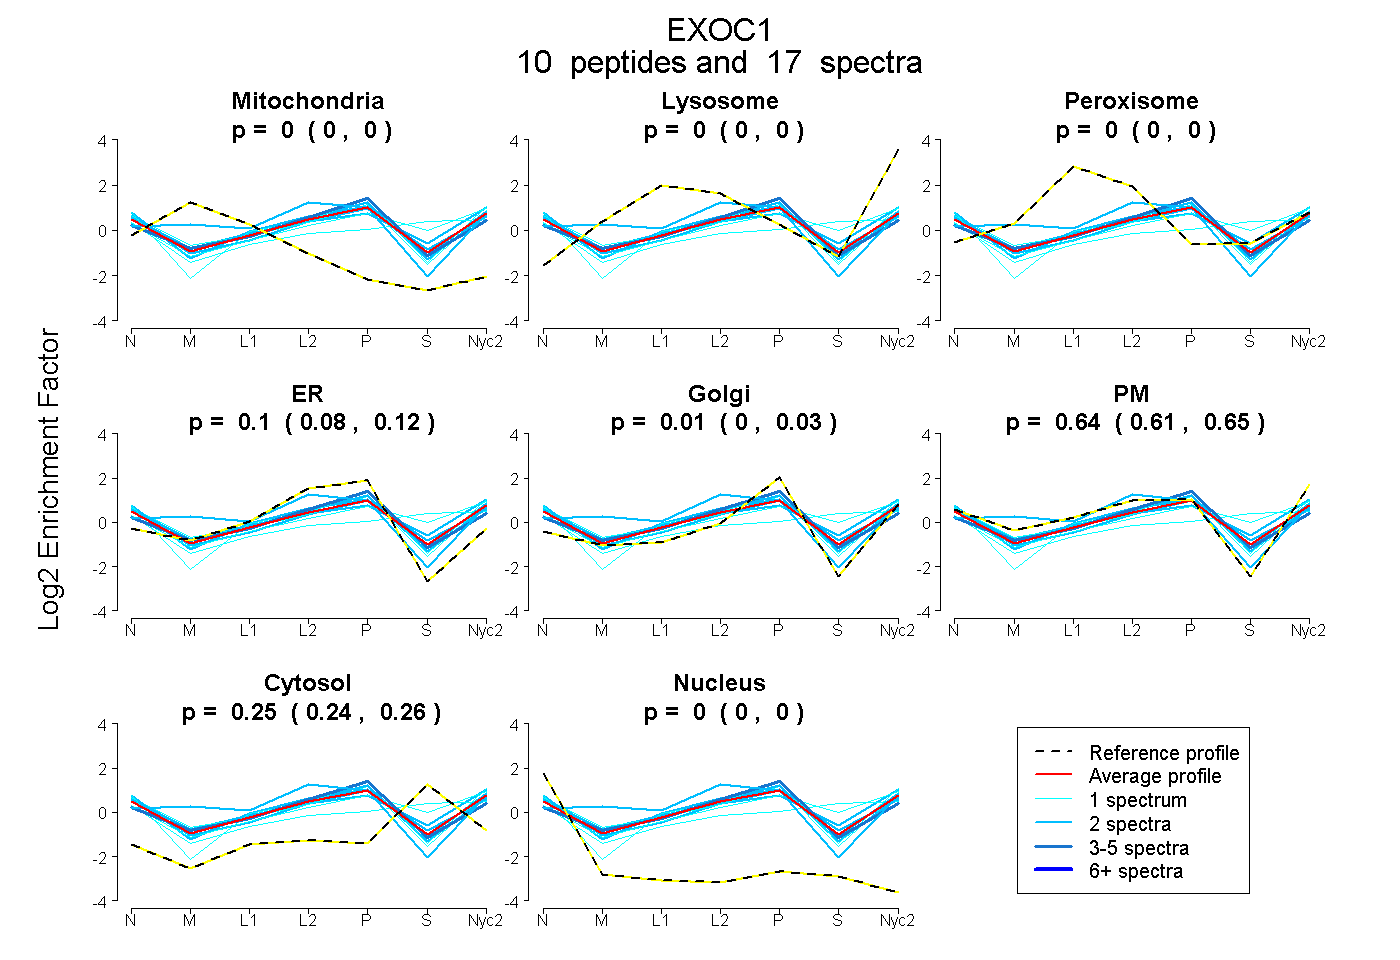
| Expt A |
10 peptides |
17 spectra |
|
0.000 0.000 | 0.000 |
0.000 0.000 | 0.000 |
0.000 0.000 | 0.000 |
0.102 0.080 | 0.118 |
0.008 0.000 | 0.035 |
0.636 0.612 | 0.651 |
0.254 0.240 | 0.264 |
0.000 0.000 | 0.000 |
| 2 spectra, DFFEVAK | 0.000 | 0.000 | 0.049 | 0.000 | 0.000 | 0.677 | 0.275 | 0.000 | ||
| 1 spectrum, ELQVLDGANIQSIMASEK | 0.000 | 0.000 | 0.000 | 0.026 | 0.138 | 0.676 | 0.140 | 0.020 | ||
| 2 spectra, ALQDGDLASSR | 0.000 | 0.000 | 0.000 | 0.089 | 0.044 | 0.585 | 0.281 | 0.001 | ||
| 3 spectra, NAFISCTWK | 0.000 | 0.000 | 0.039 | 0.262 | 0.179 | 0.329 | 0.190 | 0.000 | ||
| 2 spectra, ESPEFDLHFDK | 0.000 | 0.000 | 0.000 | 0.100 | 0.000 | 0.678 | 0.223 | 0.000 | ||
| 1 spectrum, LSSYEEMLQSVK | 0.000 | 0.025 | 0.000 | 0.000 | 0.000 | 0.582 | 0.393 | 0.000 | ||
| 2 spectra, WVASSIAEK | 0.094 | 0.041 | 0.060 | 0.290 | 0.000 | 0.515 | 0.000 | 0.000 | ||
| 2 spectra, LMEWLK | 0.000 | 0.000 | 0.000 | 0.161 | 0.081 | 0.573 | 0.185 | 0.000 | ||
| 1 spectrum, LSVQSSGSR | 0.000 | 0.000 | 0.000 | 0.039 | 0.240 | 0.540 | 0.181 | 0.000 | ||
| 1 spectrum, DLAVVDAK | 0.000 | 0.000 | 0.028 | 0.000 | 0.000 | 0.443 | 0.528 | 0.000 |
| Plot | Mito | Lyso or Perox | ER | Golgi | PM | Cytosol | Nucleus | ||||||
| Expt B |
2 peptides |
2 spectra |
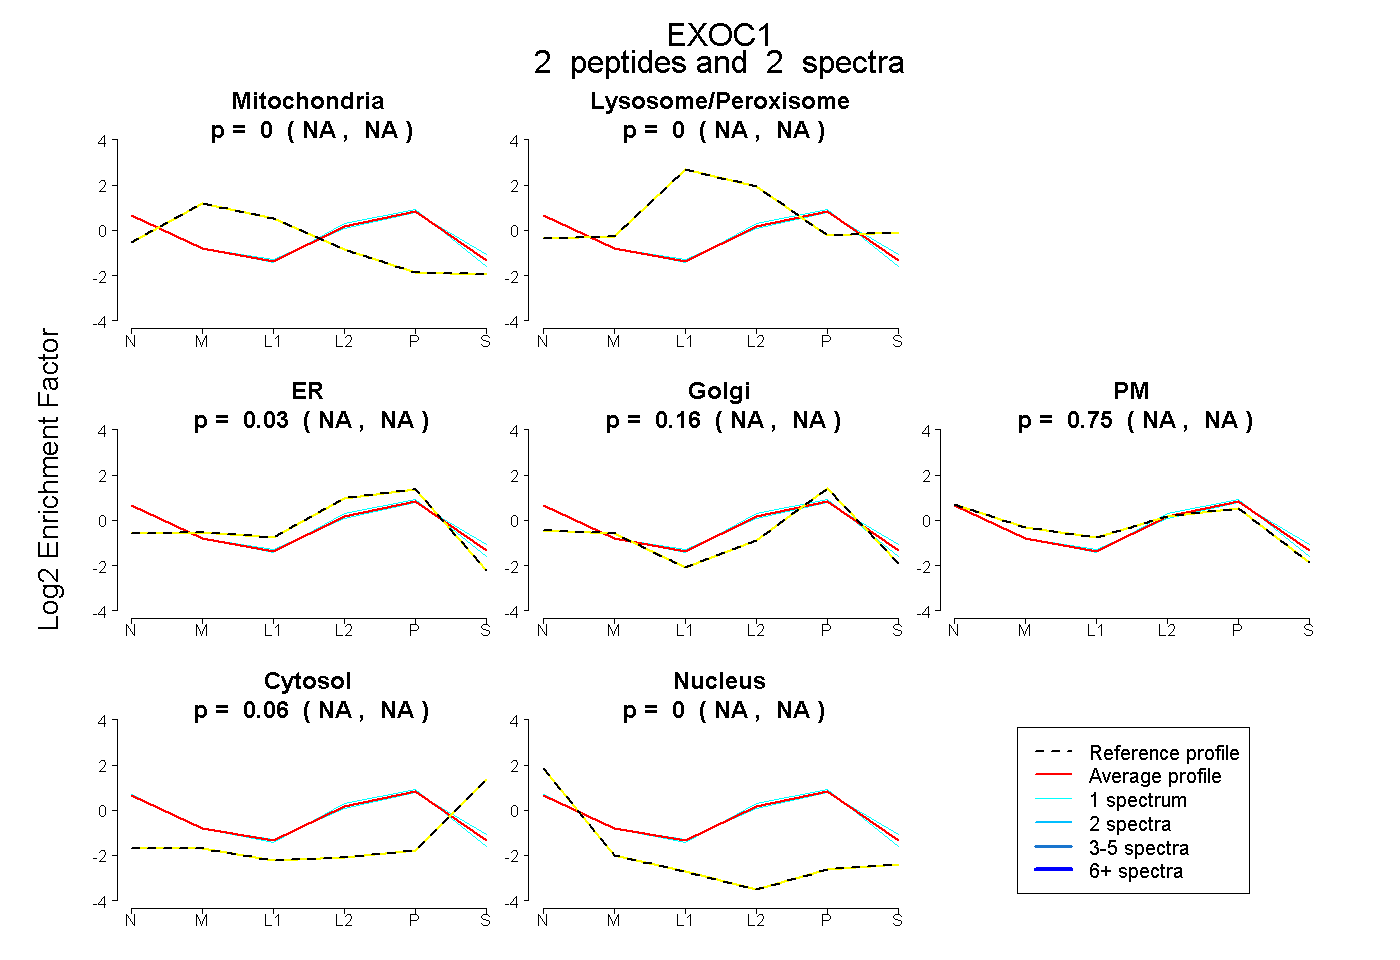 |
0.000 NA | NA |
0.000 NA | NA |
0.032 NA | NA |
0.162 NA | NA |
0.748 NA | NA |
0.058 NA | NA |
0.000 NA | NA |
|||
| Plot | Lyso | Other | |||||||||||
| Expt C |
11 peptides |
22 spectra |
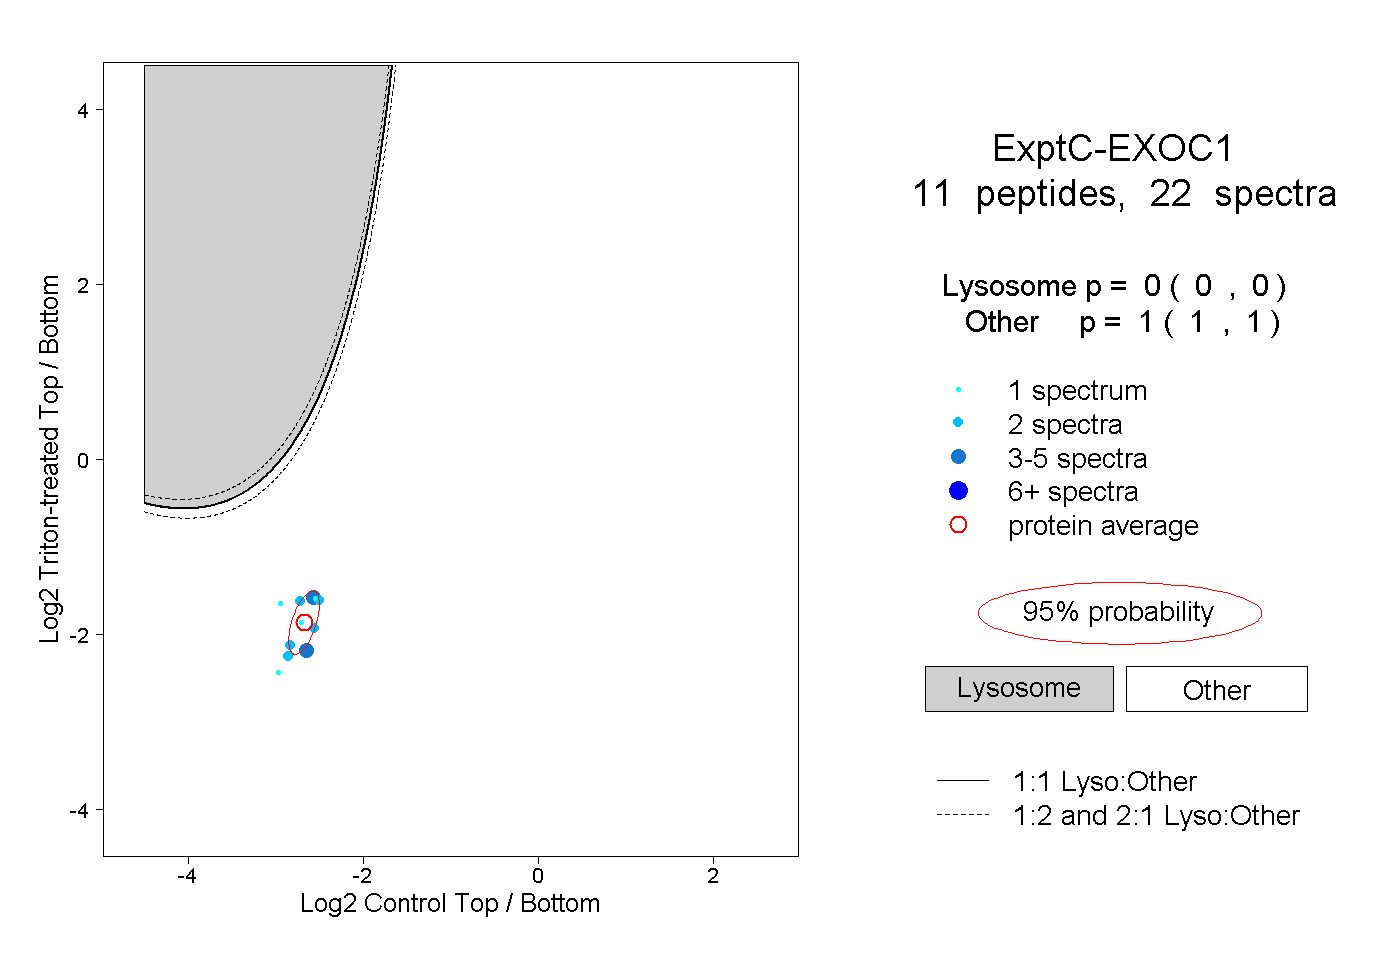 |
0.000 0.000 | 0.000 |
1.000 1.000 | 1.000 |
||||||||
| Plot | Lyso | Other | |||||||||||
| Expt D |
2 peptides |
3 spectra |
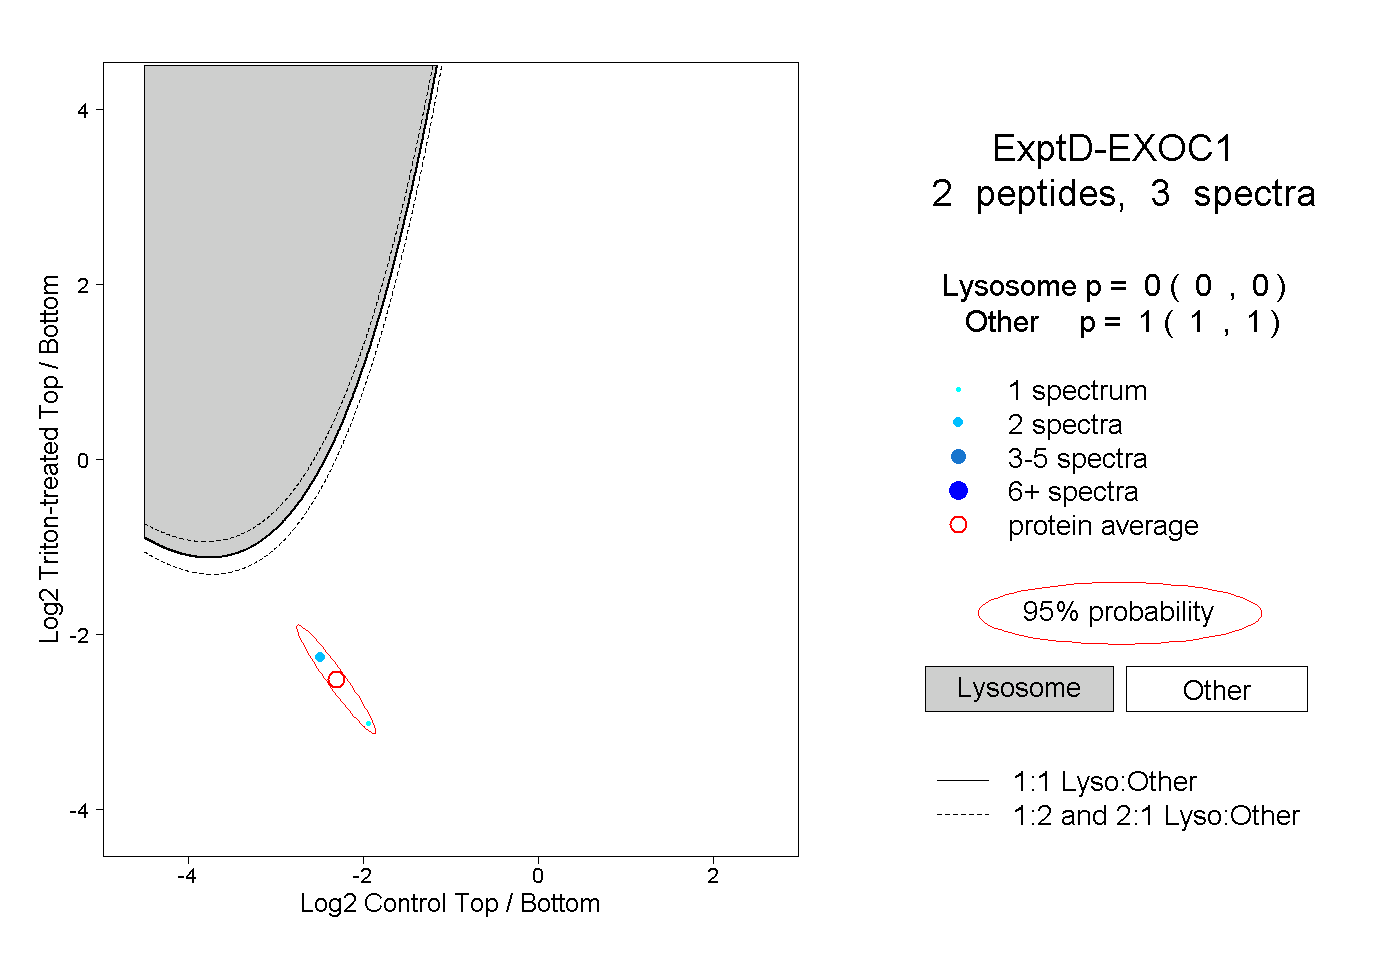 |
0.000 0.000 | 0.000 |
1.000 1.000 | 1.000 |