 4
4peptides
spectra
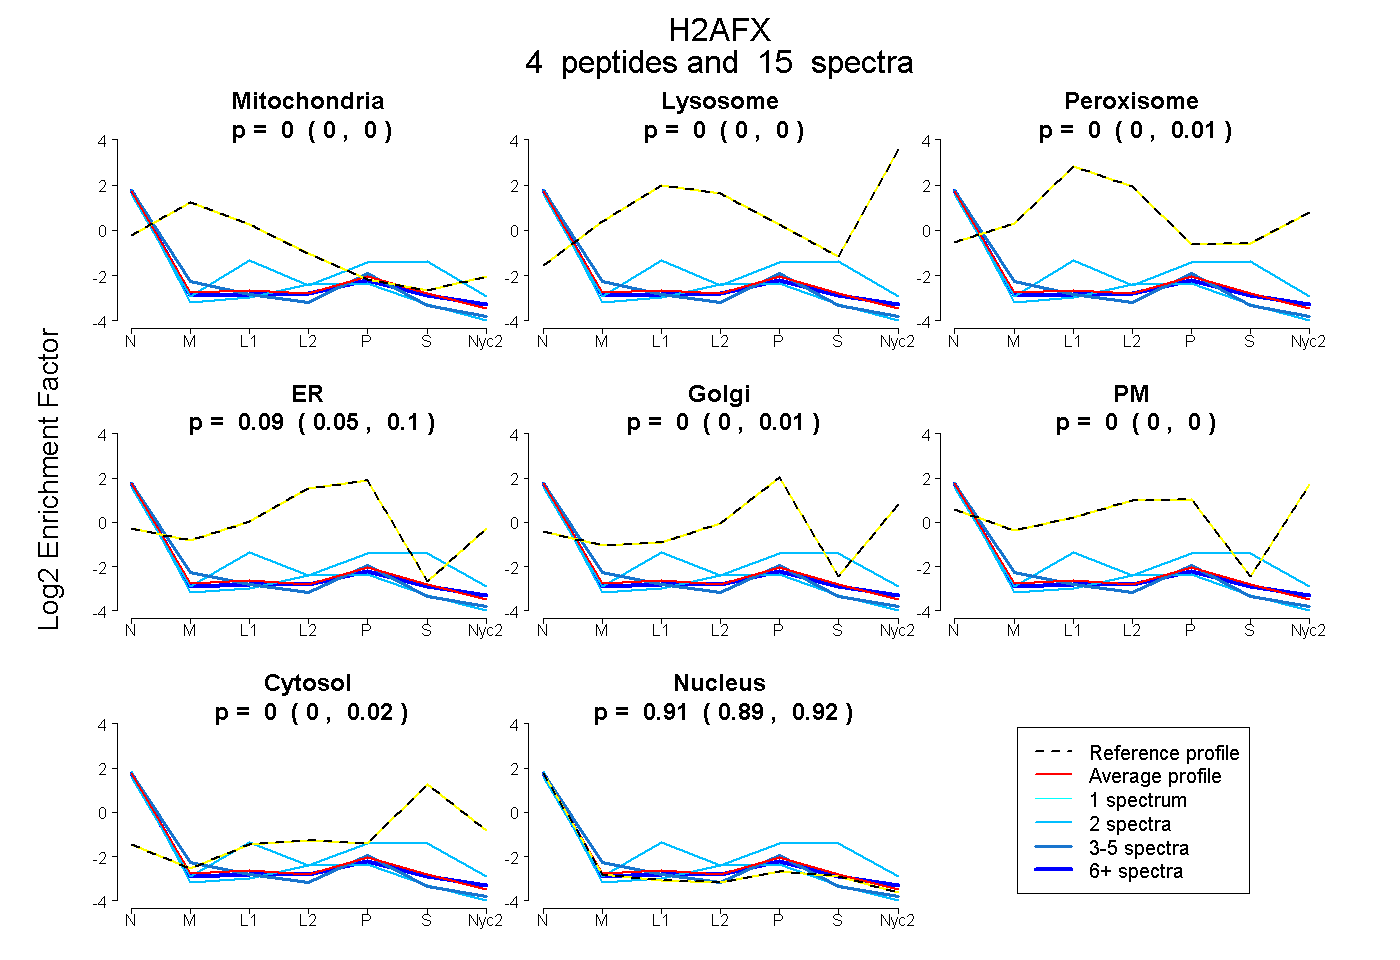
0.000 | 0.000
0.000 | 0.000
0.000 | 0.015
0.055 | 0.101
0.000 | 0.007
0.000 | 0.000
0.000 | 0.018
0.891 | 0.921
| Plot | Mito | Lyso | Perox | ER | Golgi | PM | Cytosol | Nucleus | |||||
| Expt A |
4 peptides |
15 spectra |
|
0.000 0.000 | 0.000 |
0.000 0.000 | 0.000 |
0.000 0.000 | 0.015 |
0.090 0.055 | 0.101 |
0.000 0.000 | 0.007 |
0.000 0.000 | 0.000 |
0.000 0.000 | 0.018 |
0.910 0.891 | 0.921 |
| 2 spectra, ASQASQEY | 0.000 | 0.000 | 0.114 | 0.028 | 0.000 | 0.000 | 0.177 | 0.681 | ||
| 7 spectra, APAGGK | 0.000 | 0.000 | 0.000 | 0.050 | 0.009 | 0.018 | 0.000 | 0.922 | ||
| 4 spectra, TSATVGPK | 0.031 | 0.000 | 0.000 | 0.044 | 0.000 | 0.000 | 0.000 | 0.926 | ||
| 2 spectra, GHYAER | 0.000 | 0.000 | 0.000 | 0.044 | 0.000 | 0.000 | 0.000 | 0.956 |
| Plot | Lyso | Other | |||||||||||
| Expt C |
2 peptides |
2 spectra |
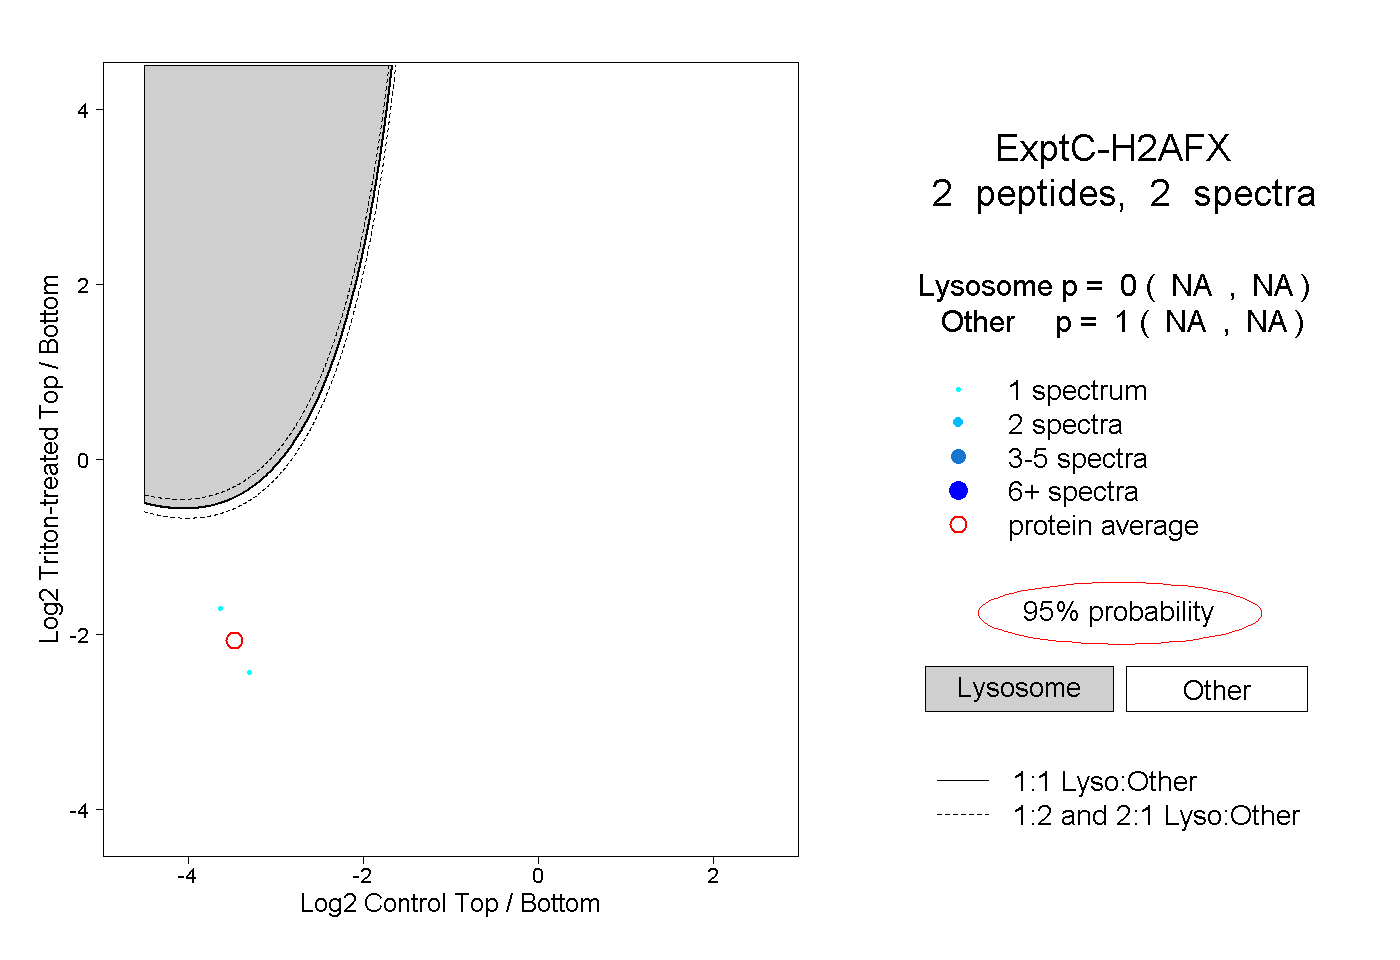 |
0.000 NA | NA |
1.000 NA | NA |