 4
4peptides
spectra
0.000 | 0.051
0.000 | 0.660
0.000 | 0.622
0.043 | 0.494
0.000 | 0.000
0.000 | 0.237
0.000 | 0.055
0.000 | 0.000
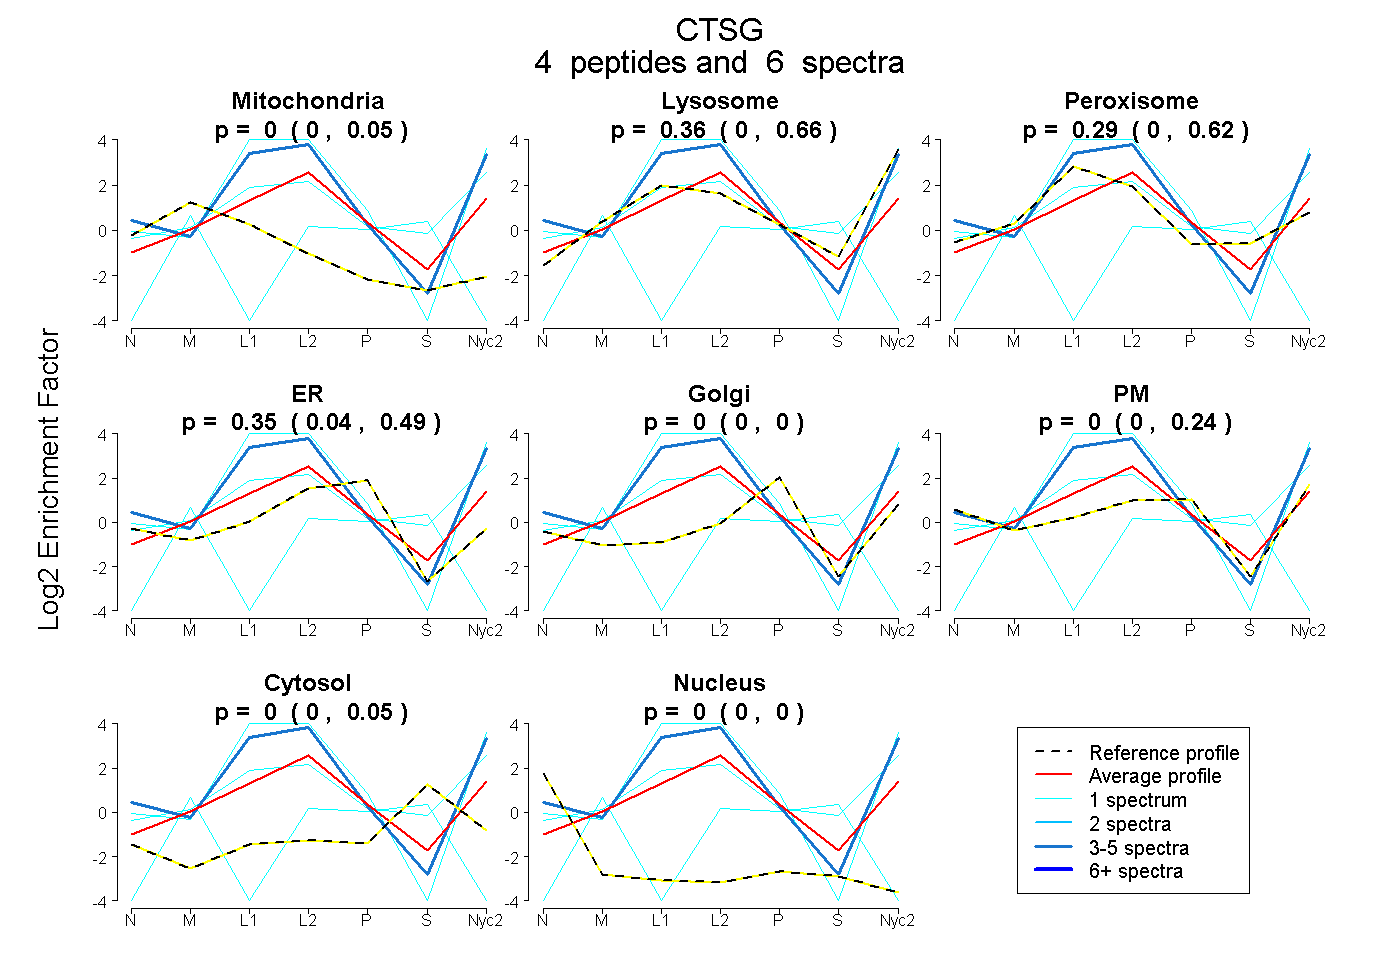
| Plot | Mito | Lyso | Perox | ER | Golgi | PM | Cytosol | Nucleus | |||||
| Expt A |
4 peptides |
6 spectra |
|
0.000 0.000 | 0.051 |
0.355 0.000 | 0.660 |
0.295 0.000 | 0.622 |
0.350 0.043 | 0.494 |
0.000 0.000 | 0.000 |
0.000 0.000 | 0.237 |
0.000 0.000 | 0.055 |
0.000 0.000 | 0.000 |
| 1 spectrum, VQPGALCTVAGWGLVSQR | 0.260 | 0.000 | 0.000 | 0.082 | 0.000 | 0.000 | 0.658 | 0.000 | ||
| 1 spectrum, HPDYNPPPVIQNDIMLLQLR | 0.000 | 0.522 | 0.390 | 0.000 | 0.000 | 0.070 | 0.018 | 0.000 | ||
| 3 spectra, VQTDQTCANR | 0.000 | 0.573 | 0.276 | 0.000 | 0.000 | 0.152 | 0.000 | 0.000 | ||
| 1 spectrum, FQFYNSQTQICVGNPR | 0.000 | 0.763 | 0.084 | 0.045 | 0.000 | 0.108 | 0.000 | 0.000 |
| Plot | Mito | Lyso or Perox | ER | Golgi | PM | Cytosol | Nucleus | ||||||
| Expt B |
1 peptide |
1 spectrum |
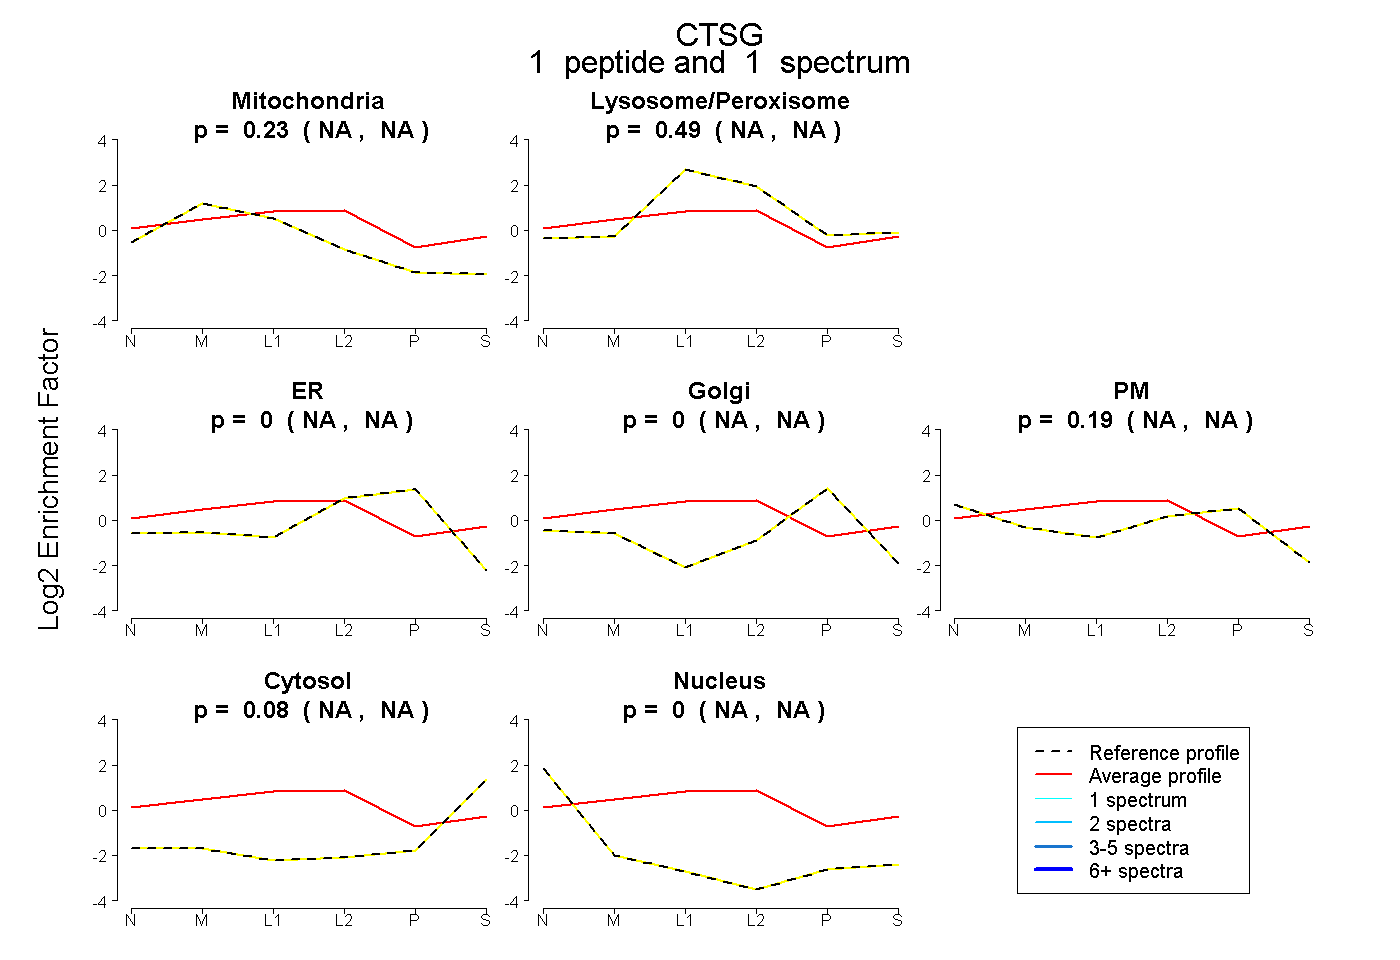 |
0.234 NA | NA |
0.490 NA | NA |
0.000 NA | NA |
0.000 NA | NA |
0.191 NA | NA |
0.085 NA | NA |
0.000 NA | NA |
|||
| Plot | Lyso | Other | |||||||||||
| Expt C |
4 peptides |
57 spectra |
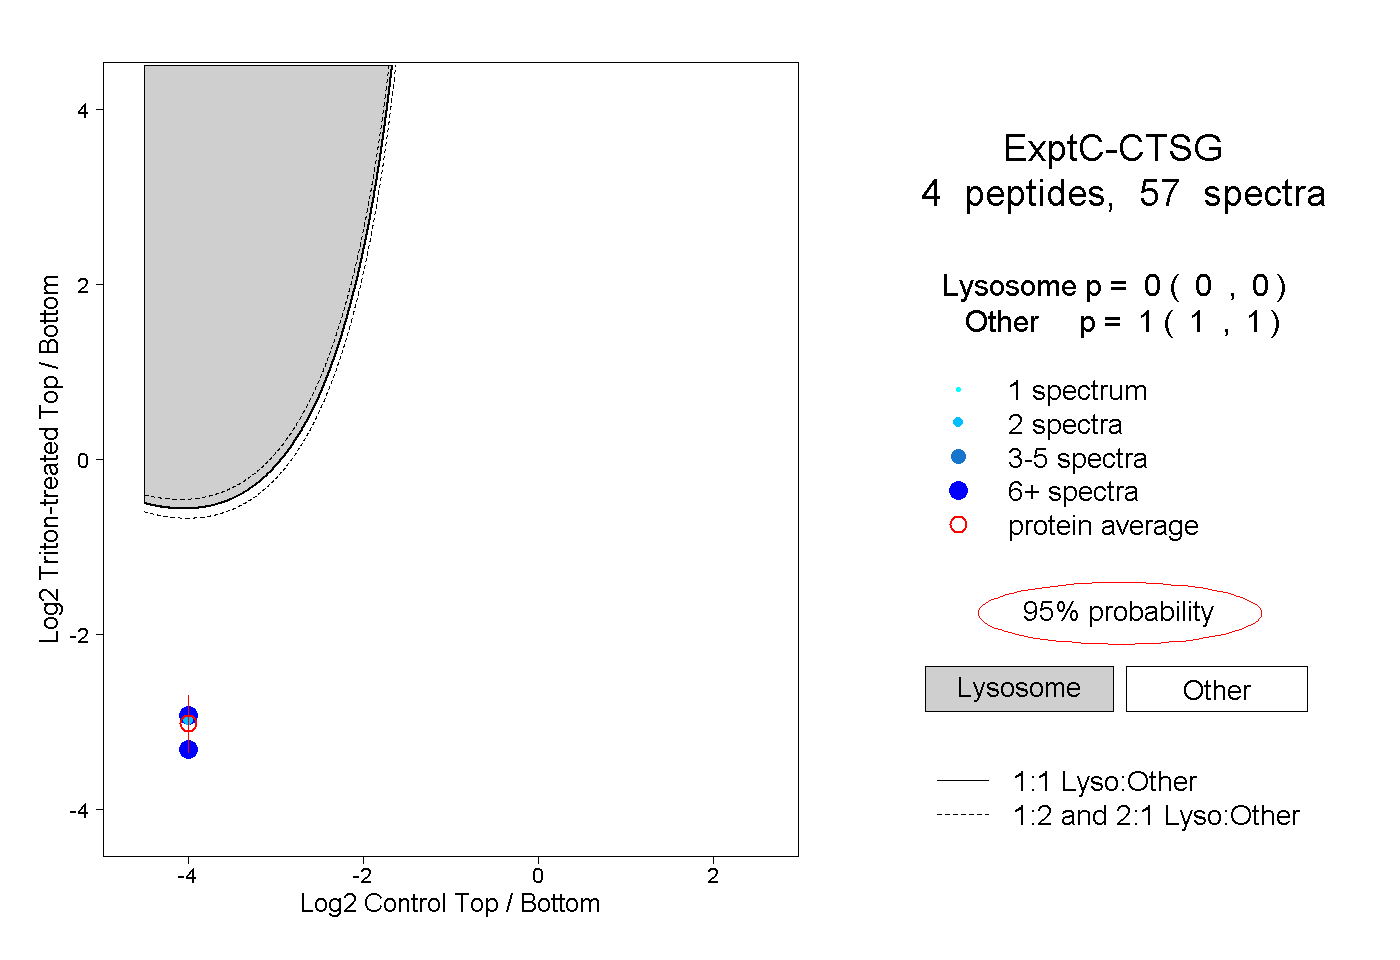 |
0.000 0.000 | 0.000 |
1.000 1.000 | 1.000 |
||||||||
| Plot | Lyso | Other | |||||||||||
| Expt D |
2 peptides |
4 spectra |
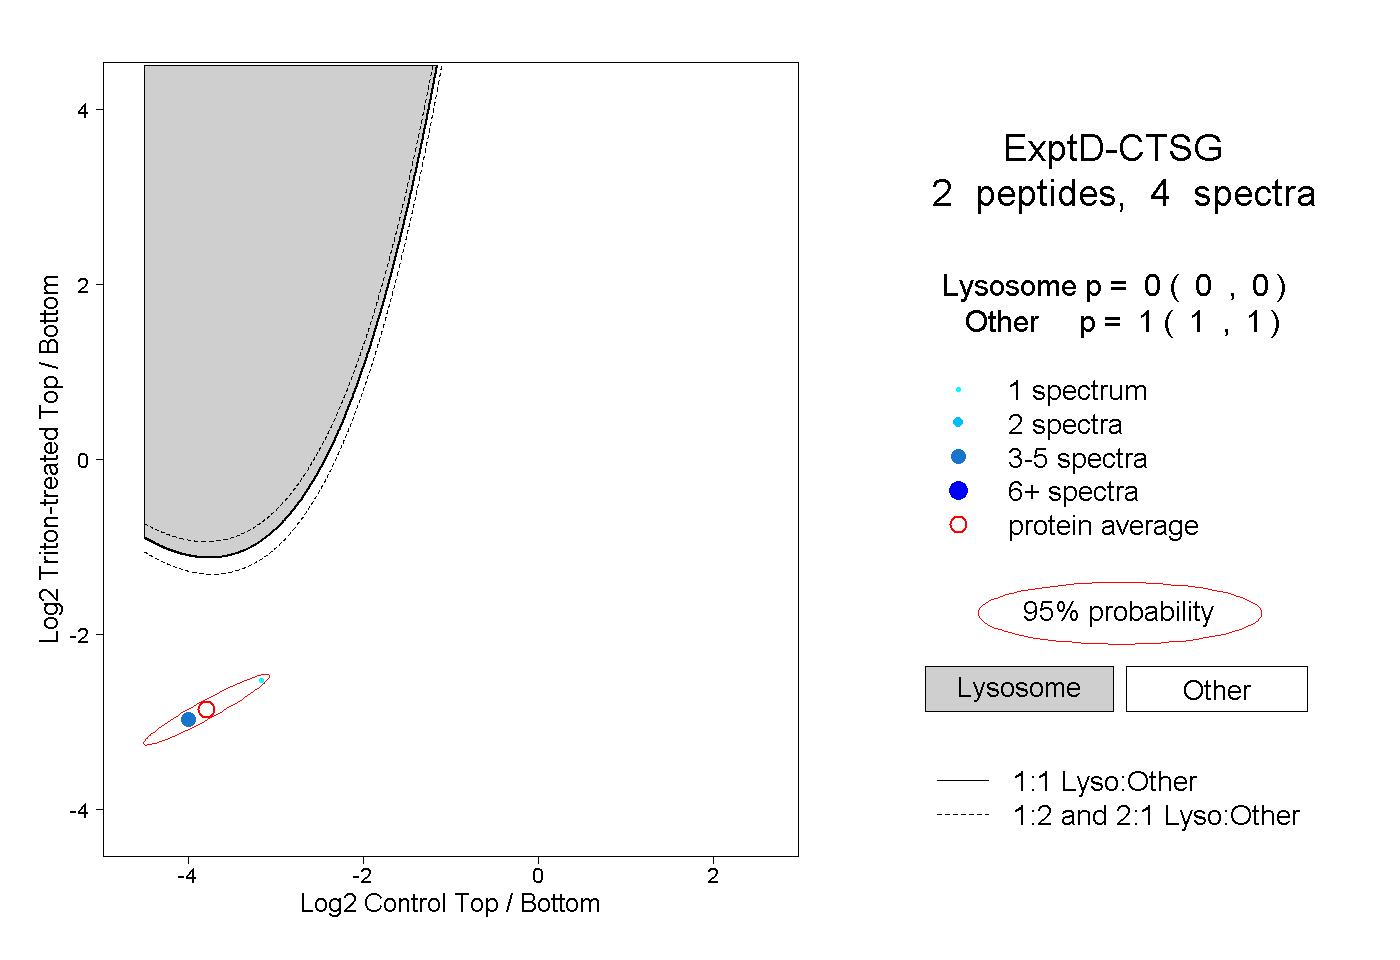 |
0.000 0.000 | 0.000 |
1.000 1.000 | 1.000 |