 33
33peptides
spectra
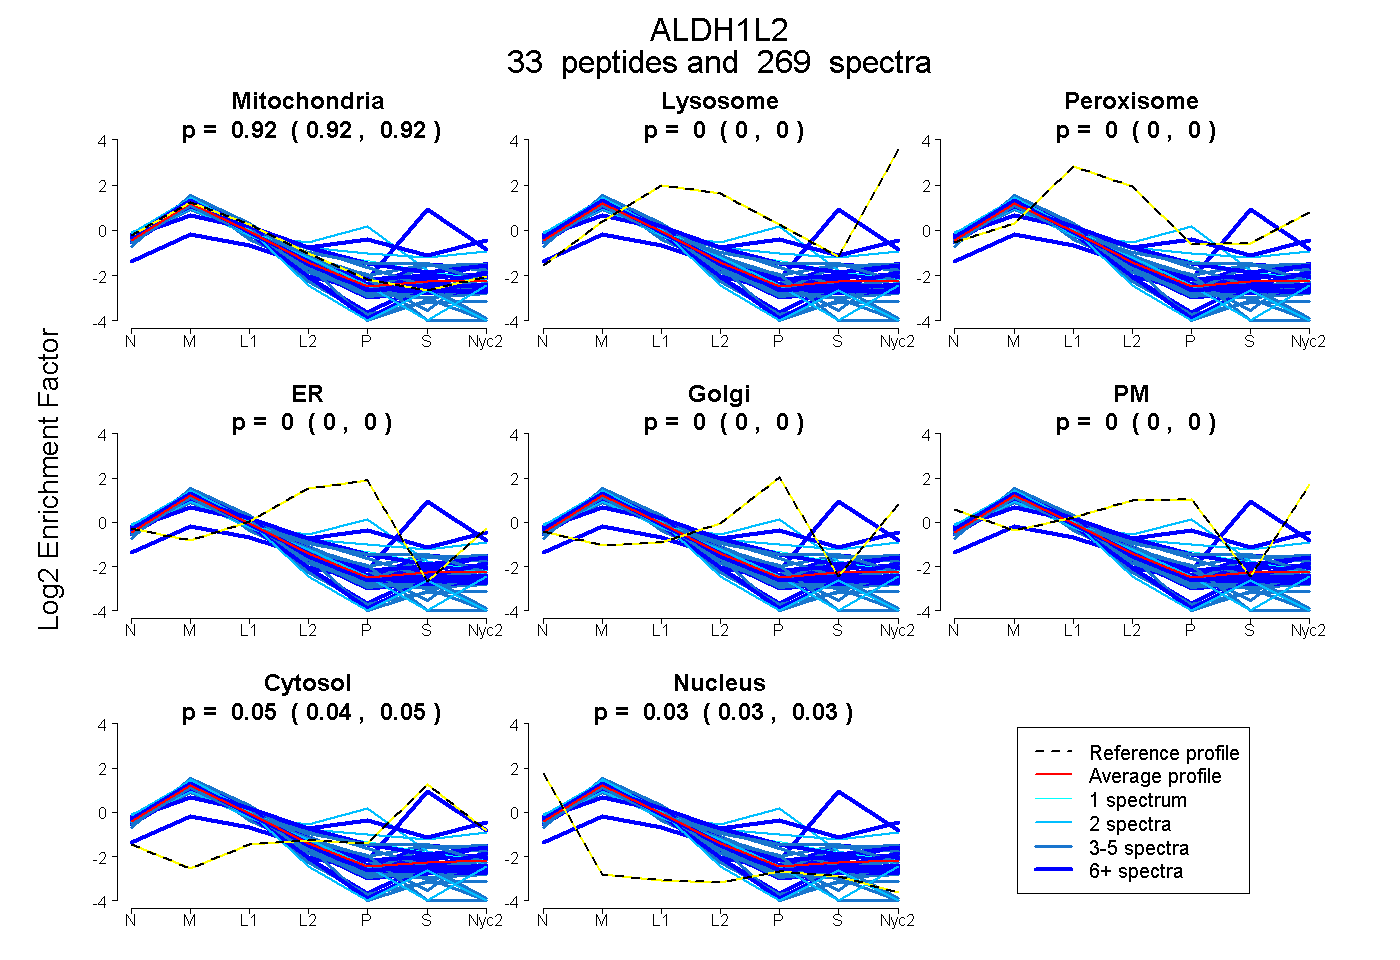
0.920 | 0.924
0.000 | 0.000
0.000 | 0.000
0.000 | 0.000
0.000 | 0.000
0.000 | 0.000
0.043 | 0.049
0.029 | 0.033
31peptides
spectra
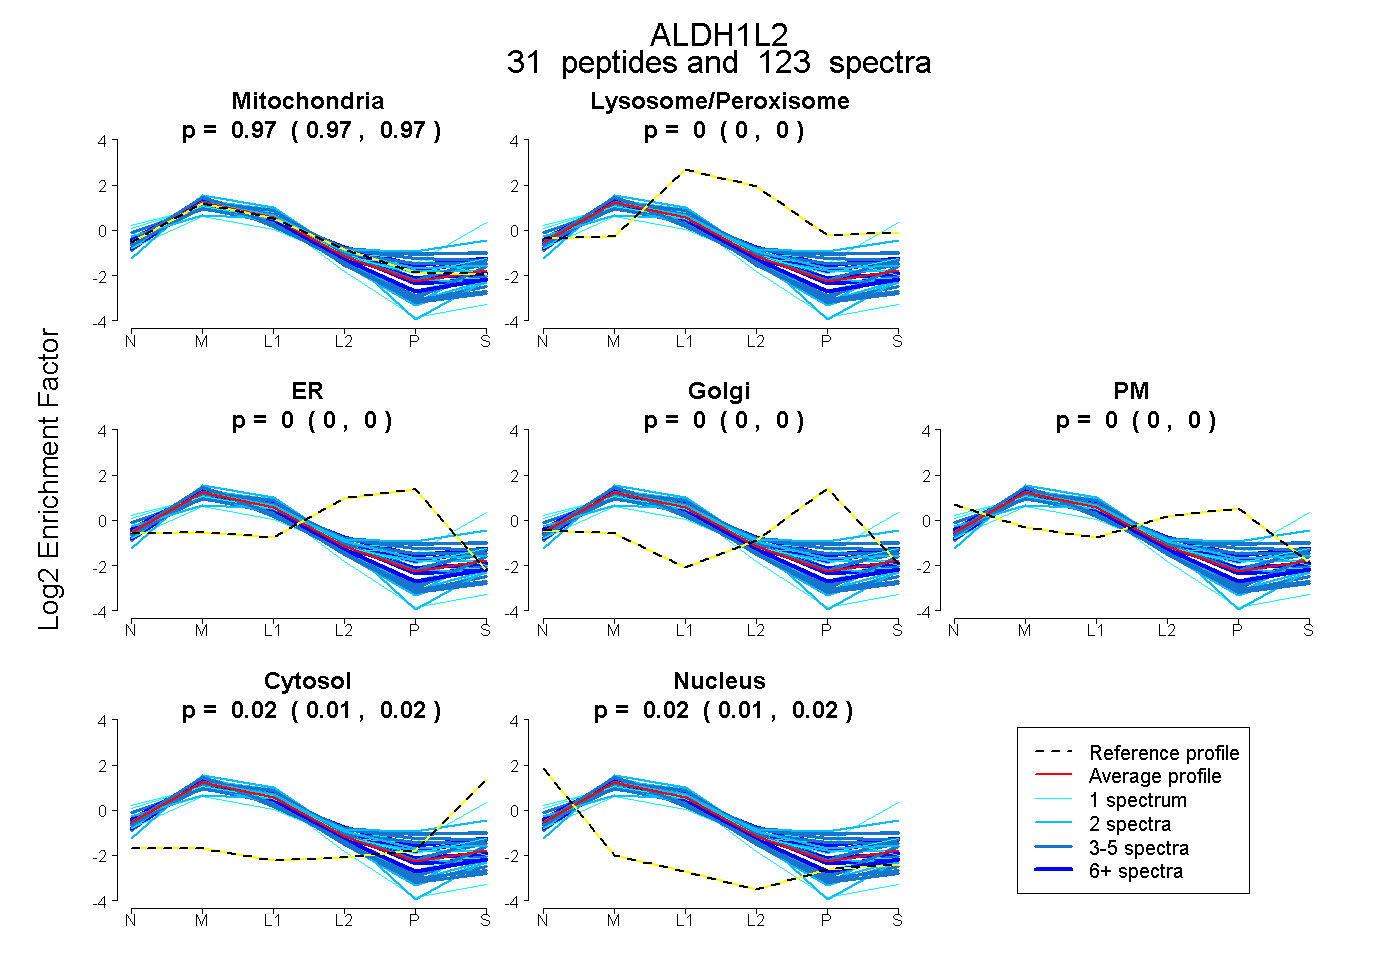
0.965 | 0.969
0.000 | 0.000
0.000 | 0.000
0.000 | 0.000
0.000 | 0.000
0.013 | 0.020
0.014 | 0.018
46peptides
spectra
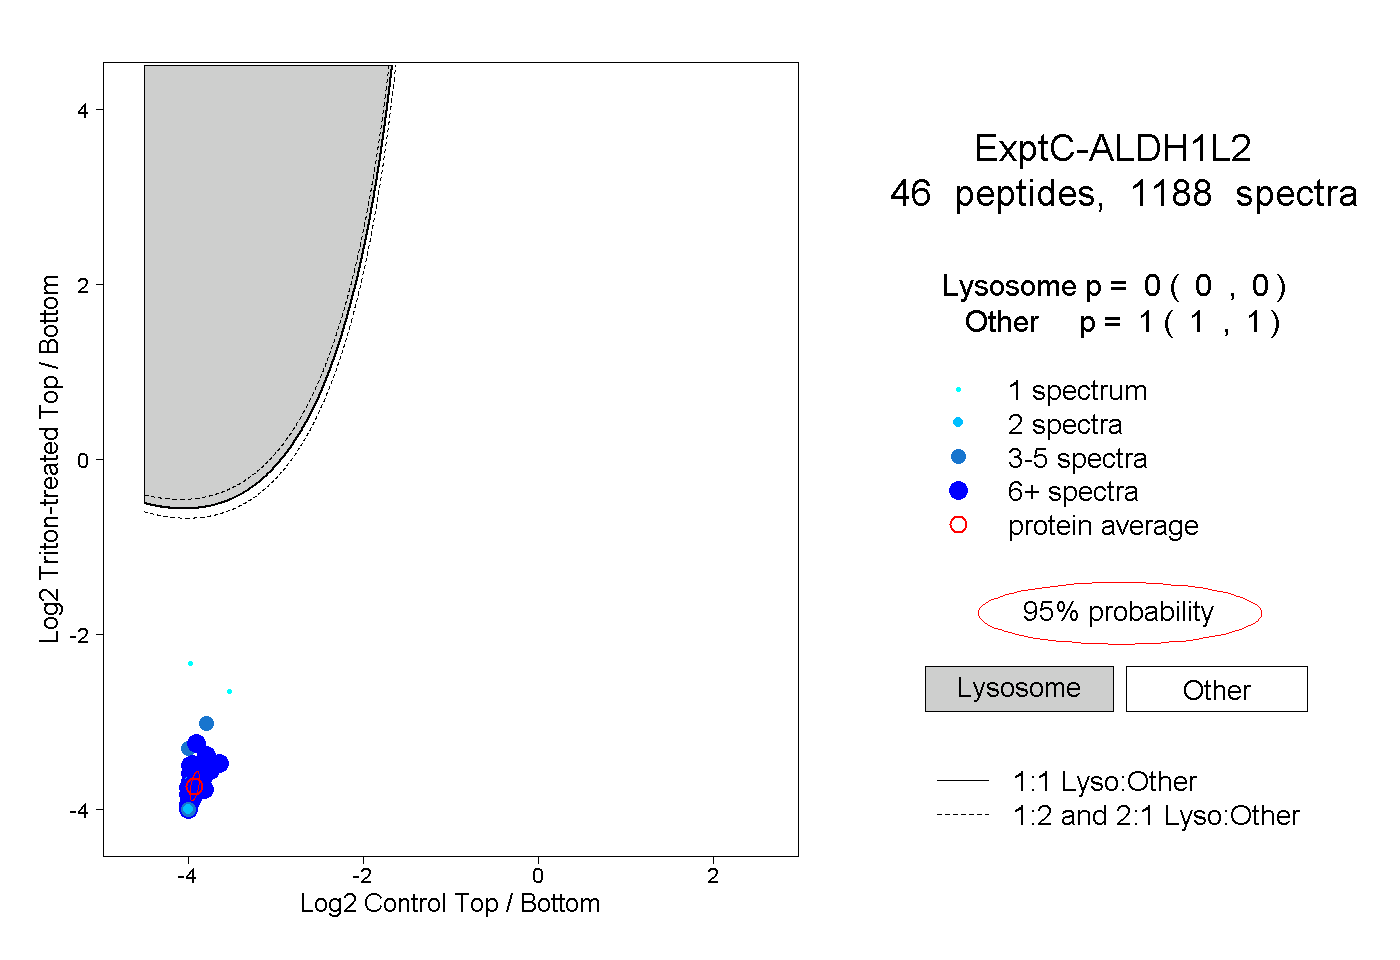
0.000 | 0.000
1.000 | 1.000
31peptides
spectra
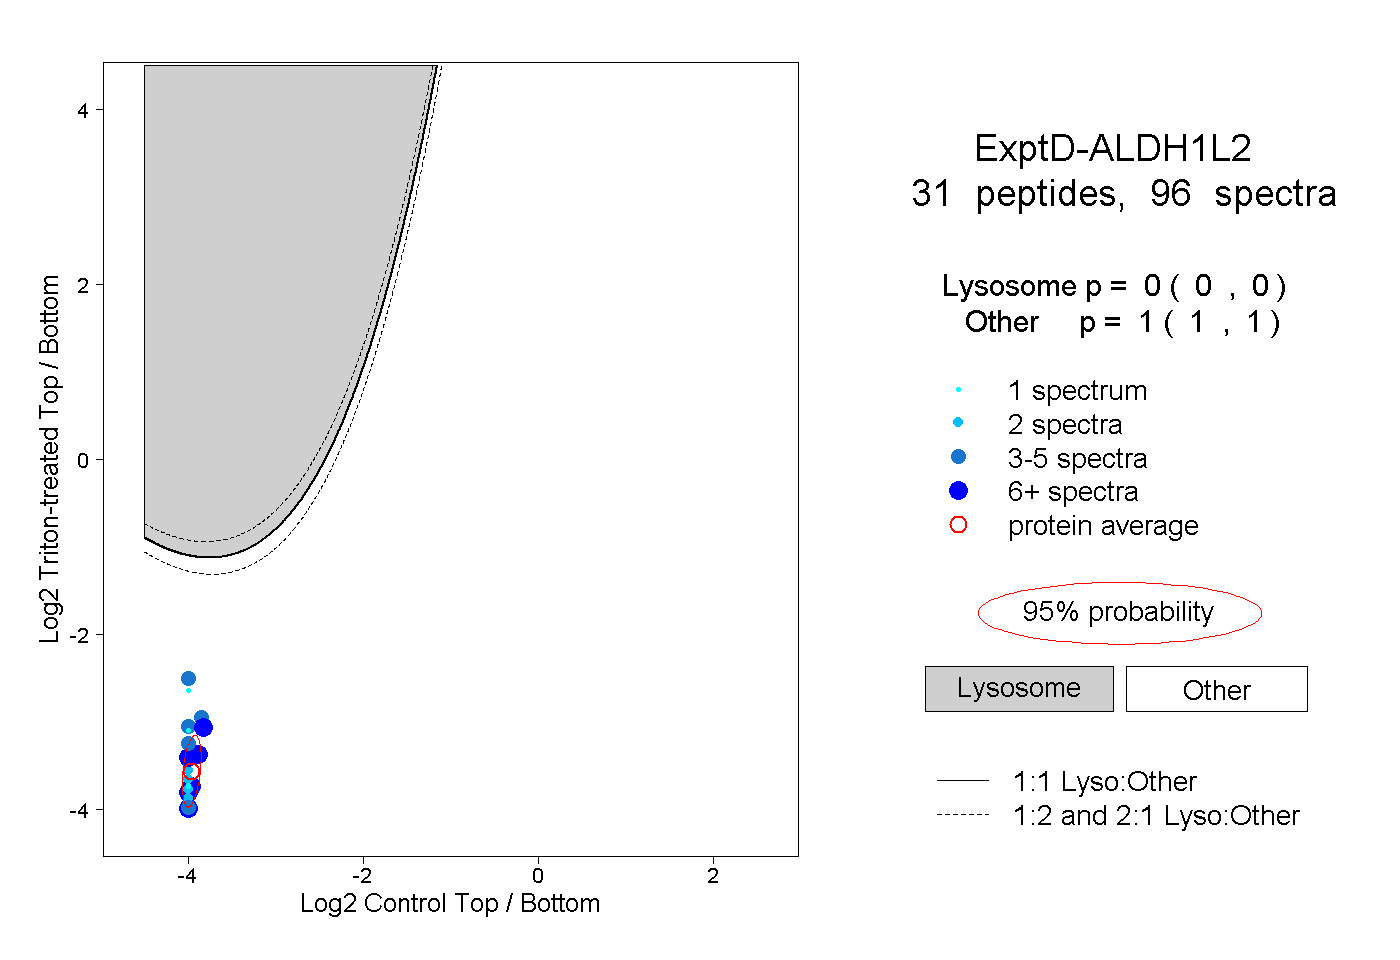
0.000 | 0.000
1.000 | 1.000