 4
4peptides
spectra
0.000 | 0.000
0.360 | 0.421
0.000 | 0.000
0.000 | 0.000
0.150 | 0.252
0.000 | 0.043
0.355 | 0.411
0.000 | 0.000
5peptides
spectra
0.000 | 0.992
0.008 | 1.000
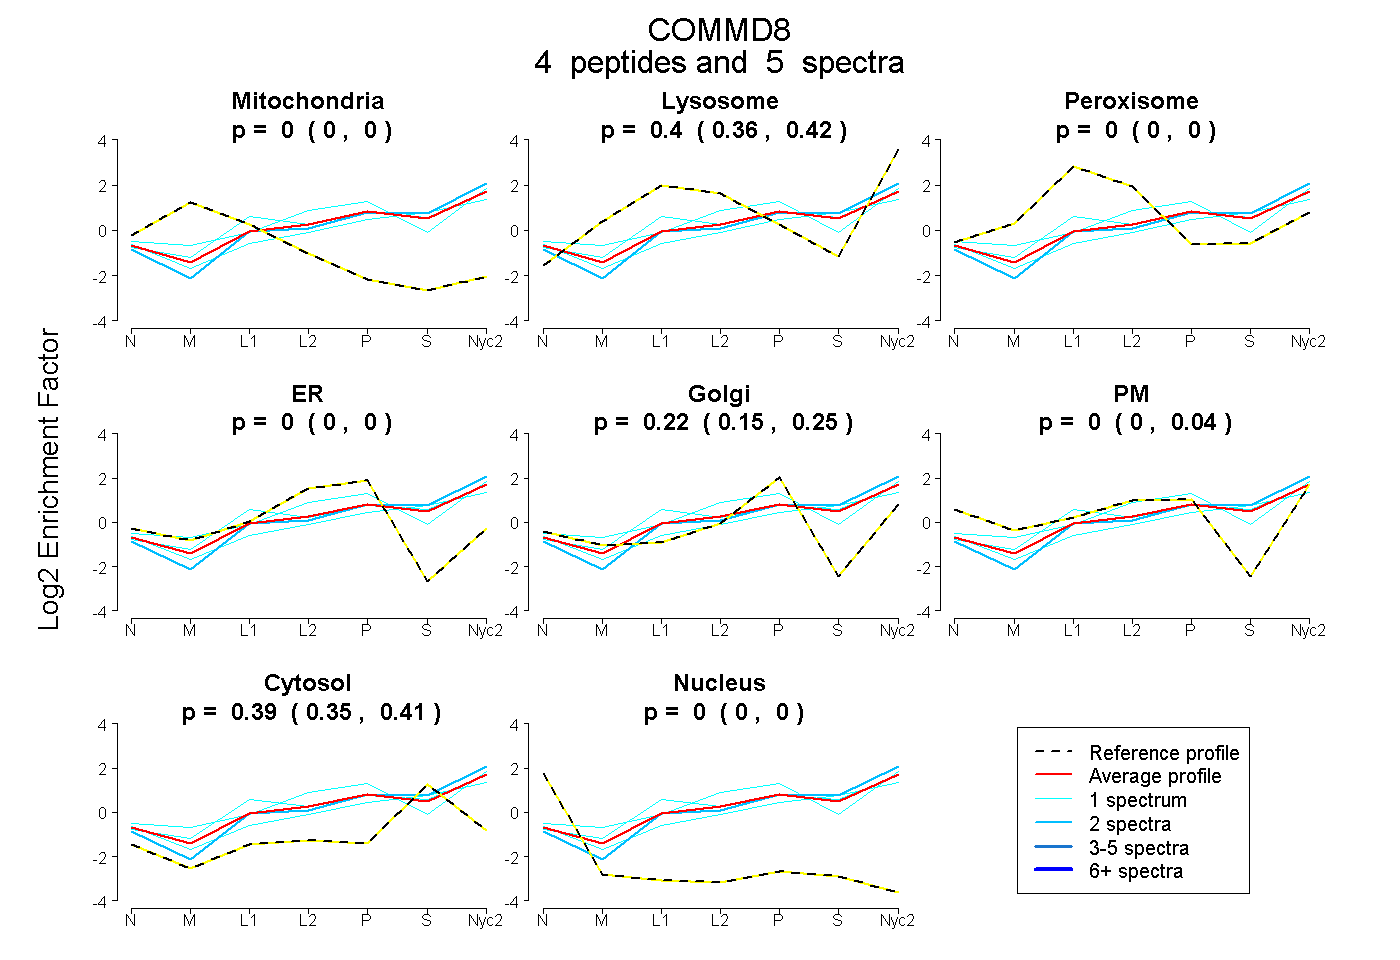
| Plot | Mito | Lyso | Perox | ER | Golgi | PM | Cytosol | Nucleus | |||||
| Expt A |
4 peptides |
5 spectra |
|
0.000 0.000 | 0.000 |
0.396 0.360 | 0.421 |
0.000 0.000 | 0.000 |
0.000 0.000 | 0.000 |
0.218 0.150 | 0.252 |
0.000 0.000 | 0.043 |
0.386 0.355 | 0.411 |
0.000 0.000 | 0.000 |
||
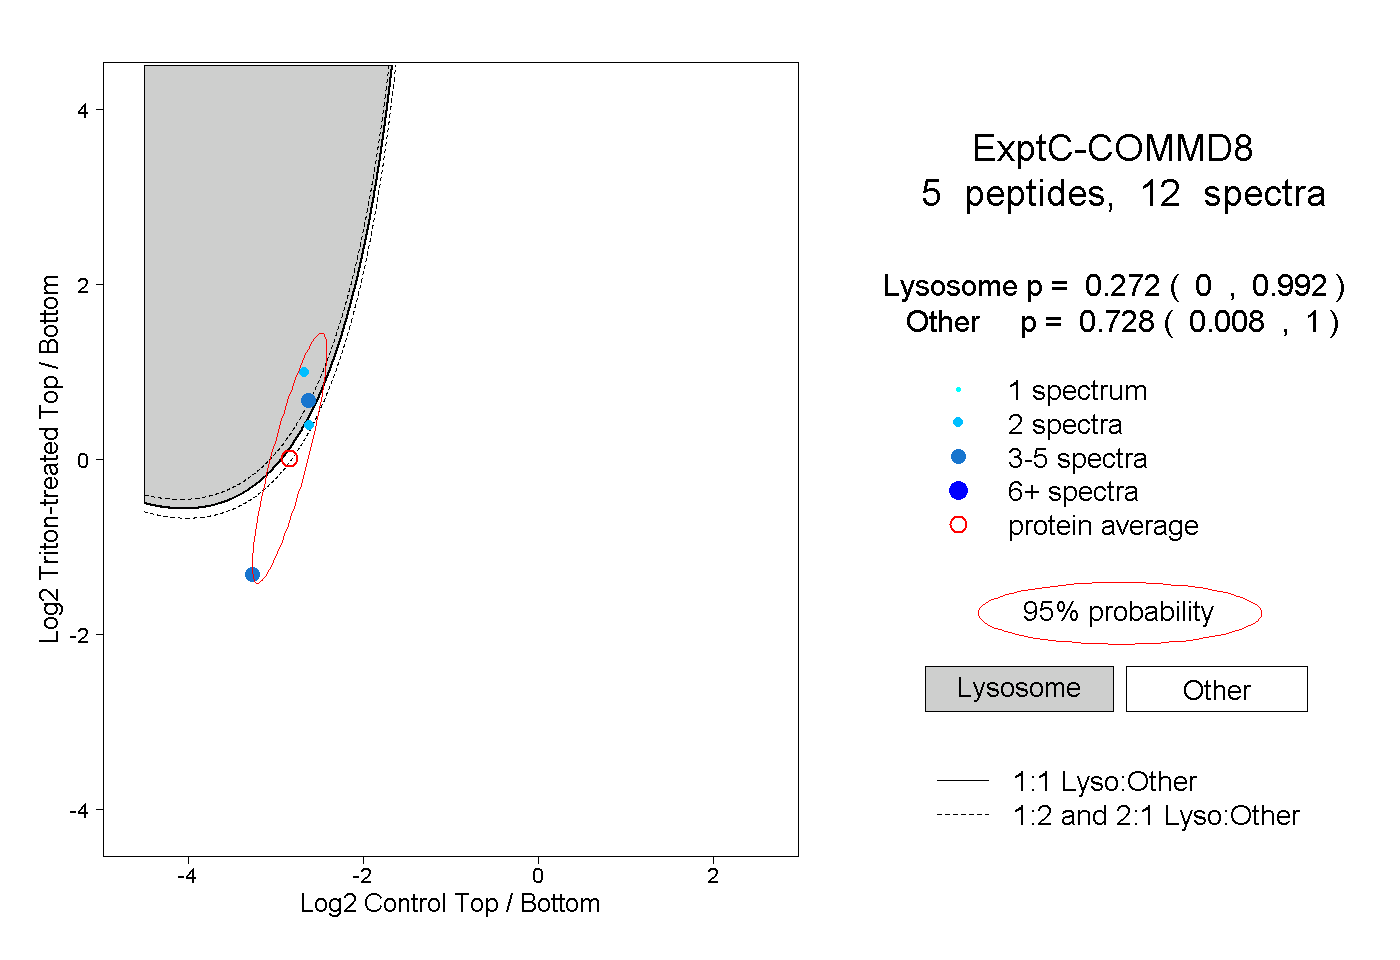
| Plot | Lyso | Other | |||||||||||
| Expt C |
5 peptides |
12 spectra |
|
0.272 0.000 | 0.992 |
0.728 0.008 | 1.000 |
| 2 spectra, IIDGICGR | 0.993 | 0.007 | ||||||||
| 3 spectra, LPPEQGAGLLHK | 0.000 | 1.000 | ||||||||
| 4 spectra, LALSSDK | 0.838 | 0.162 | ||||||||
| 1 spectrum, HVLEDVTTFFK | 0.000 | 1.000 | ||||||||
| 2 spectra, VVLQLK | 0.287 | 0.713 |
| Plot | Lyso | Other | |||||||||||
| Expt D |
1 peptide |
3 spectra |
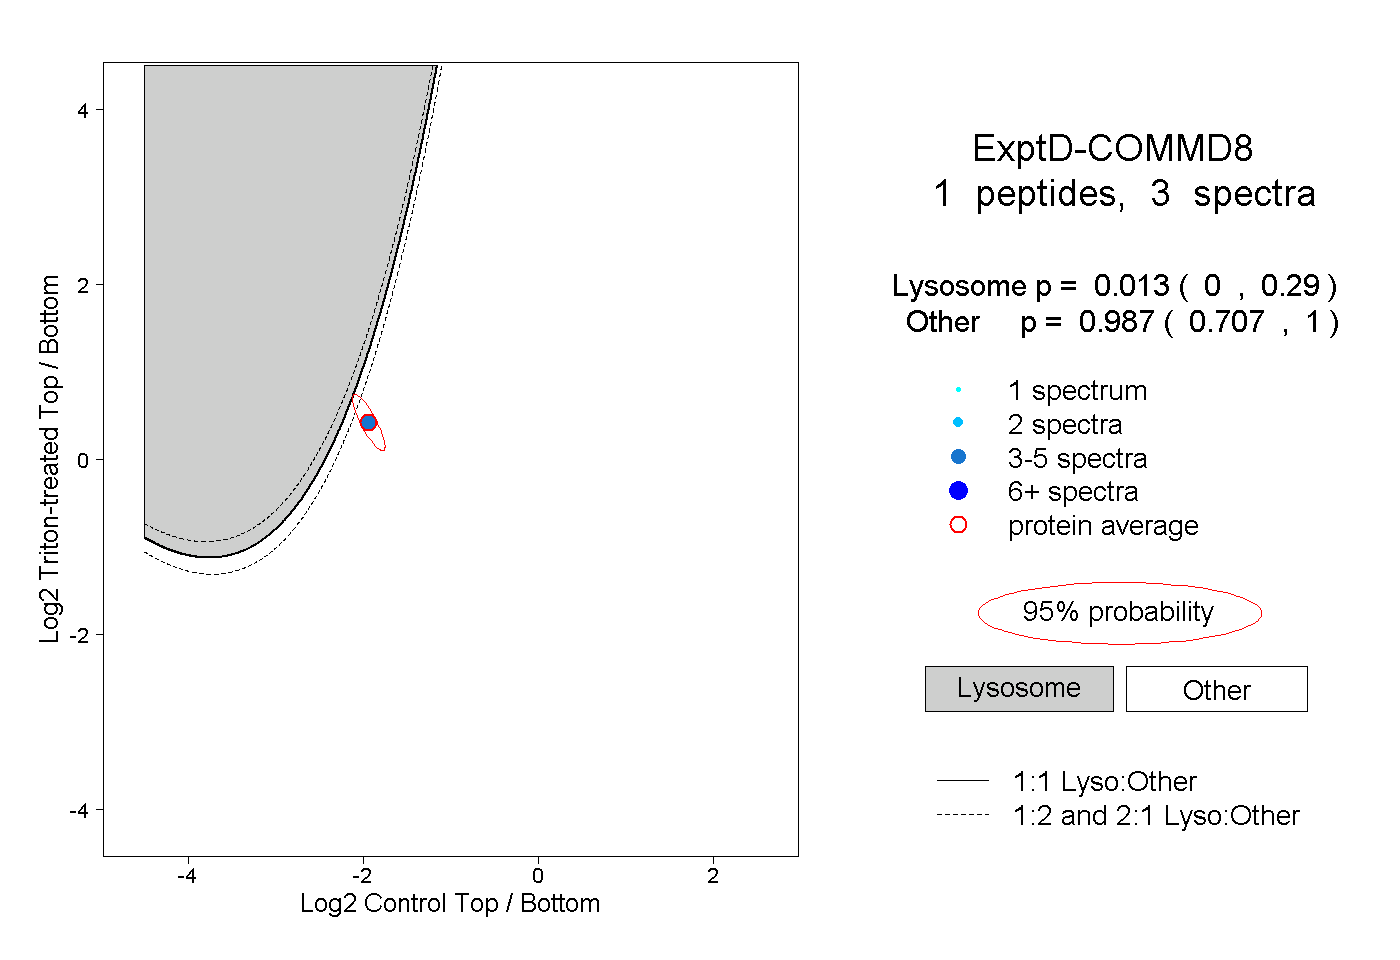 |
0.013 0.000 | 0.290 |
0.987 0.707 | 1.000 |