 3
3peptides
spectra
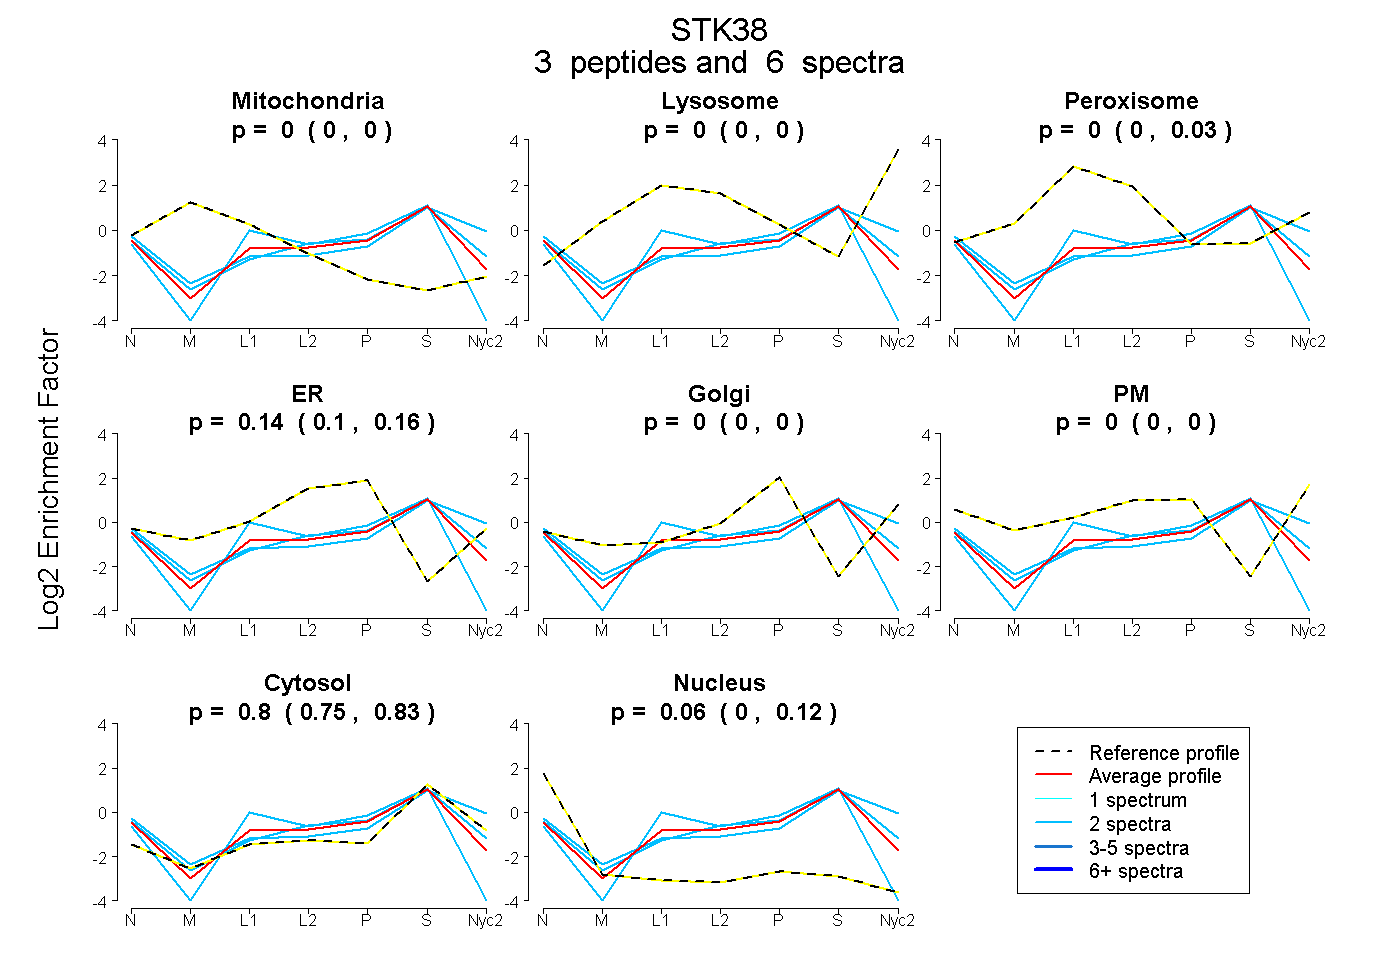
0.000 | 0.000
0.000 | 0.000
0.000 | 0.026
0.105 | 0.164
0.000 | 0.000
0.000 | 0.000
0.745 | 0.831
0.001 | 0.117
| Plot | Mito | Lyso | Perox | ER | Golgi | PM | Cytosol | Nucleus | |||||
| Expt A |
3 peptides |
6 spectra |
|
0.000 0.000 | 0.000 |
0.000 0.000 | 0.000 |
0.000 0.000 | 0.026 |
0.143 0.105 | 0.164 |
0.000 0.000 | 0.000 |
0.000 0.000 | 0.000 |
0.795 0.745 | 0.831 |
0.062 0.001 | 0.117 |
| 2 spectra, FCCEWEHR | 0.000 | 0.000 | 0.000 | 0.172 | 0.000 | 0.000 | 0.798 | 0.031 | ||
| 2 spectra, ERPAAISIEIK | 0.000 | 0.000 | 0.000 | 0.000 | 0.000 | 0.187 | 0.811 | 0.001 | ||
| 2 spectra, SNPFFEGVDWEHIR | 0.000 | 0.000 | 0.000 | 0.108 | 0.000 | 0.000 | 0.736 | 0.156 |
| Plot | Lyso | Other | |||||||||||
| Expt C |
1 peptide |
2 spectra |
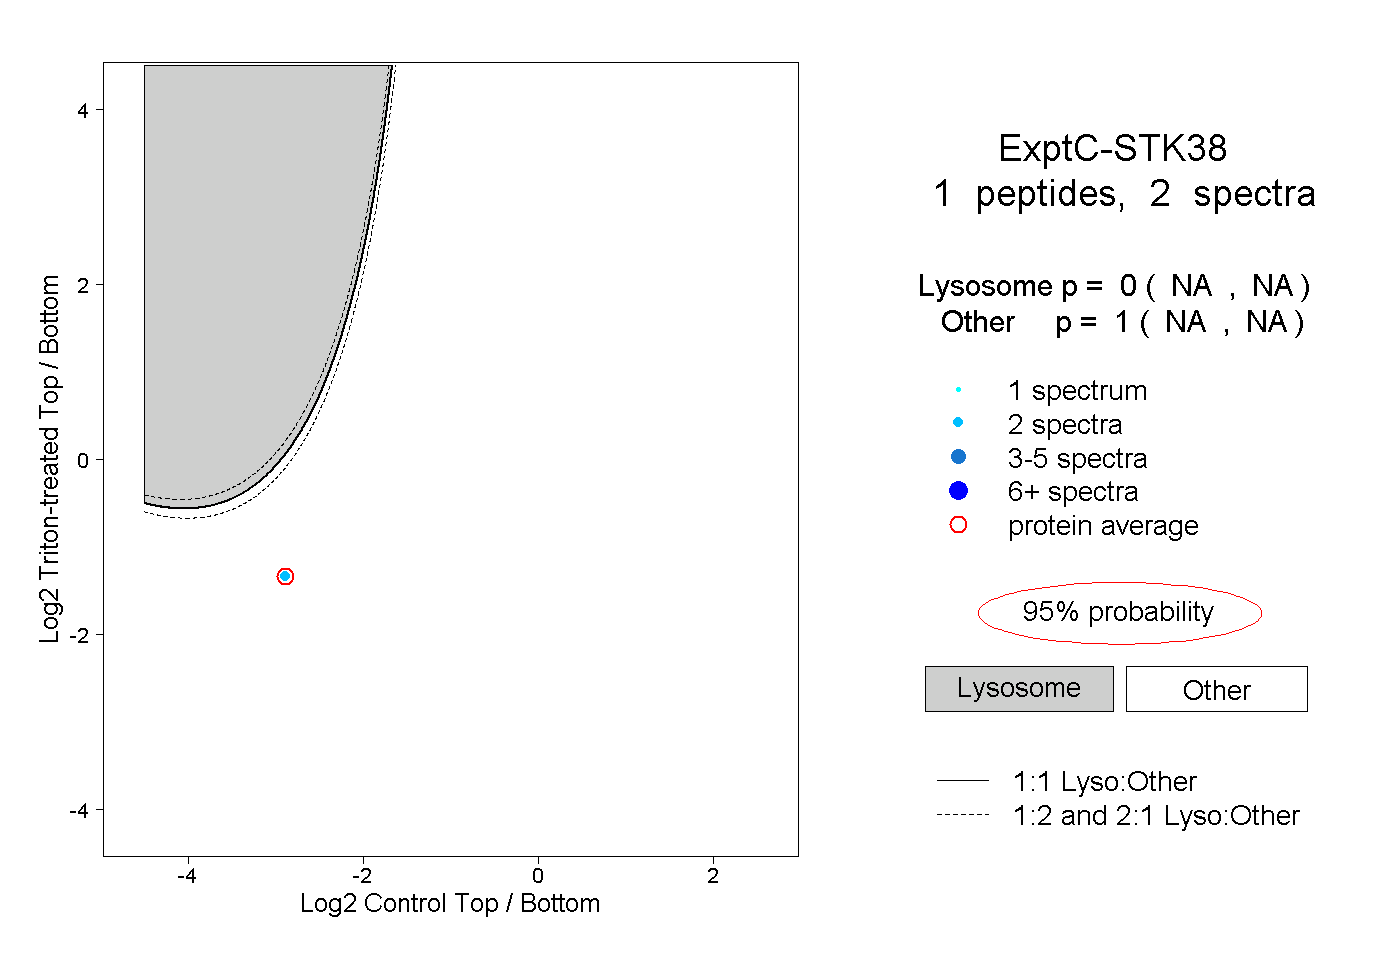 |
0.000 NA | NA |
1.000 NA | NA |