 11
11peptides
spectra
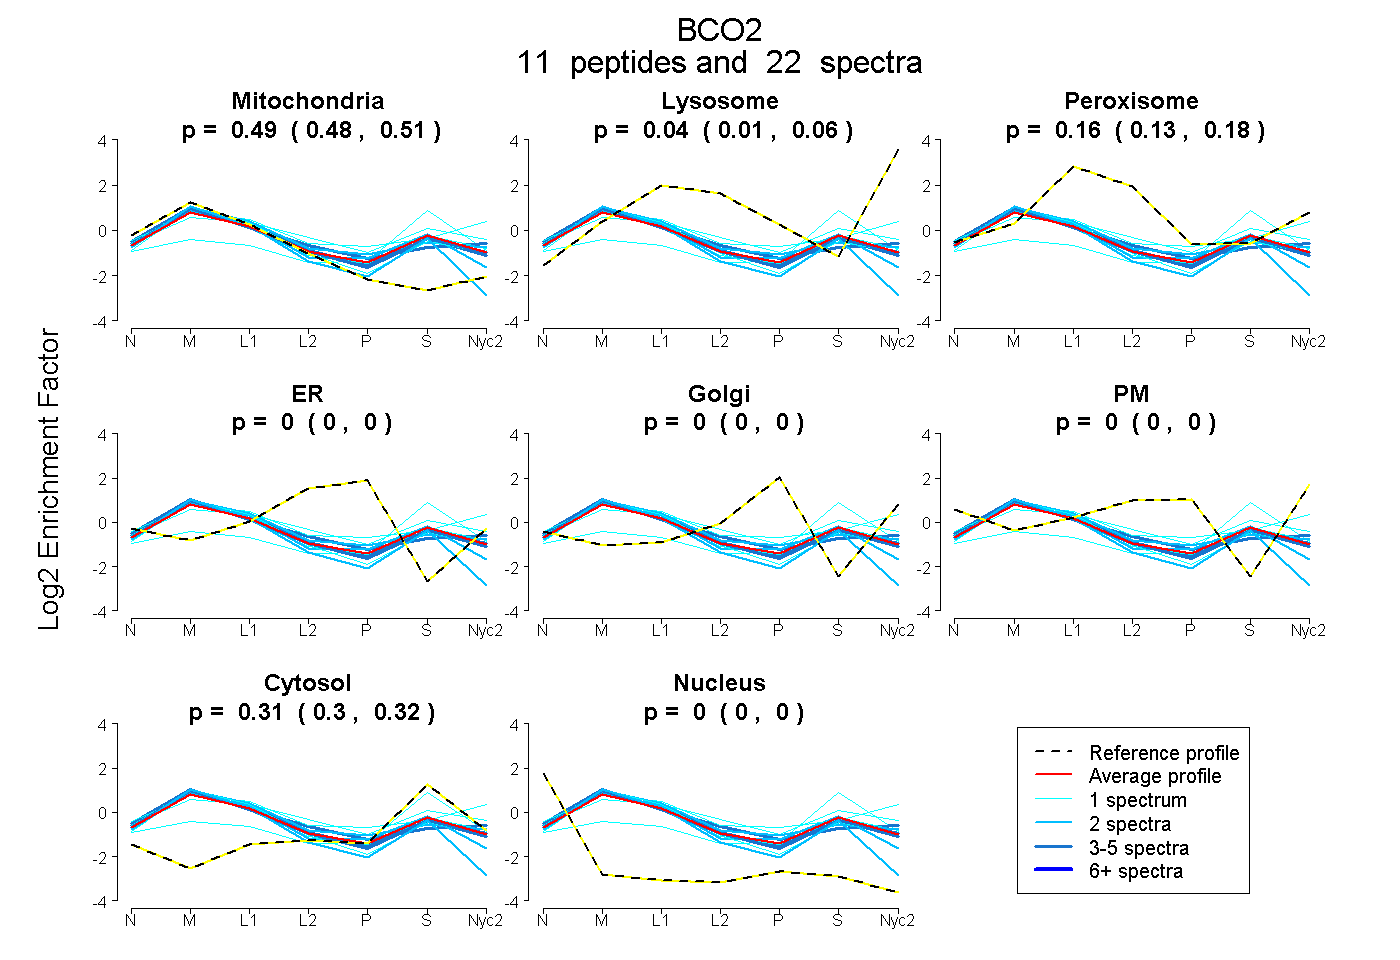
0.483 | 0.505
0.012 | 0.059
0.131 | 0.176
0.000 | 0.000
0.000 | 0.000
0.000 | 0.000
0.303 | 0.319
0.000 | 0.000
| Plot | Mito | Lyso | Perox | ER | Golgi | PM | Cytosol | Nucleus | |||||
| Expt A |
11 peptides |
22 spectra |
|
0.495 0.483 | 0.505 |
0.036 0.012 | 0.059 |
0.158 0.131 | 0.176 |
0.000 0.000 | 0.000 |
0.000 0.000 | 0.000 |
0.000 0.000 | 0.000 |
0.311 0.303 | 0.319 |
0.000 0.000 | 0.000 |
| 2 spectra, GSCYNIIR | 0.552 | 0.000 | 0.135 | 0.000 | 0.000 | 0.000 | 0.312 | 0.000 | ||
| 1 spectrum, AGEELDQVYK | 0.264 | 0.018 | 0.061 | 0.000 | 0.000 | 0.000 | 0.657 | 0.000 | ||
| 1 spectrum, SFADGISWEPQYNTR | 0.574 | 0.026 | 0.149 | 0.000 | 0.000 | 0.000 | 0.251 | 0.000 | ||
| 2 spectra, YSFFYGCGFR | 0.733 | 0.000 | 0.000 | 0.000 | 0.000 | 0.000 | 0.267 | 0.000 | ||
| 1 spectrum, FEPPTMTDNTSVNFVQYK | 0.319 | 0.080 | 0.276 | 0.000 | 0.000 | 0.000 | 0.325 | 0.000 | ||
| 2 spectra, NYIVFVEQPLK | 0.517 | 0.131 | 0.117 | 0.000 | 0.000 | 0.000 | 0.235 | 0.000 | ||
| 1 spectrum, GDYYMSTETNFMNK | 0.521 | 0.122 | 0.043 | 0.000 | 0.000 | 0.000 | 0.314 | 0.000 | ||
| 3 spectra, FLQSDTYK | 0.553 | 0.178 | 0.052 | 0.000 | 0.000 | 0.000 | 0.217 | 0.000 | ||
| 4 spectra, VDIETLER | 0.548 | 0.057 | 0.113 | 0.000 | 0.000 | 0.000 | 0.282 | 0.000 | ||
| 1 spectrum, GTVTYK | 0.377 | 0.327 | 0.047 | 0.000 | 0.000 | 0.009 | 0.241 | 0.000 | ||
| 4 spectra, AEVPVR | 0.534 | 0.003 | 0.181 | 0.000 | 0.000 | 0.000 | 0.282 | 0.000 |
| Plot | Mito | Lyso or Perox | ER | Golgi | PM | Cytosol | Nucleus | ||||||
| Expt B |
9 peptides |
19 spectra |
 |
0.546 0.539 | 0.553 |
0.235 0.229 | 0.240 |
0.000 0.000 | 0.000 |
0.000 0.000 | 0.000 |
0.000 0.000 | 0.000 |
0.218 0.213 | 0.222 |
0.000 0.000 | 0.000 |
|||
| Plot | Lyso | Other | |||||||||||
| Expt C |
18 peptides |
91 spectra |
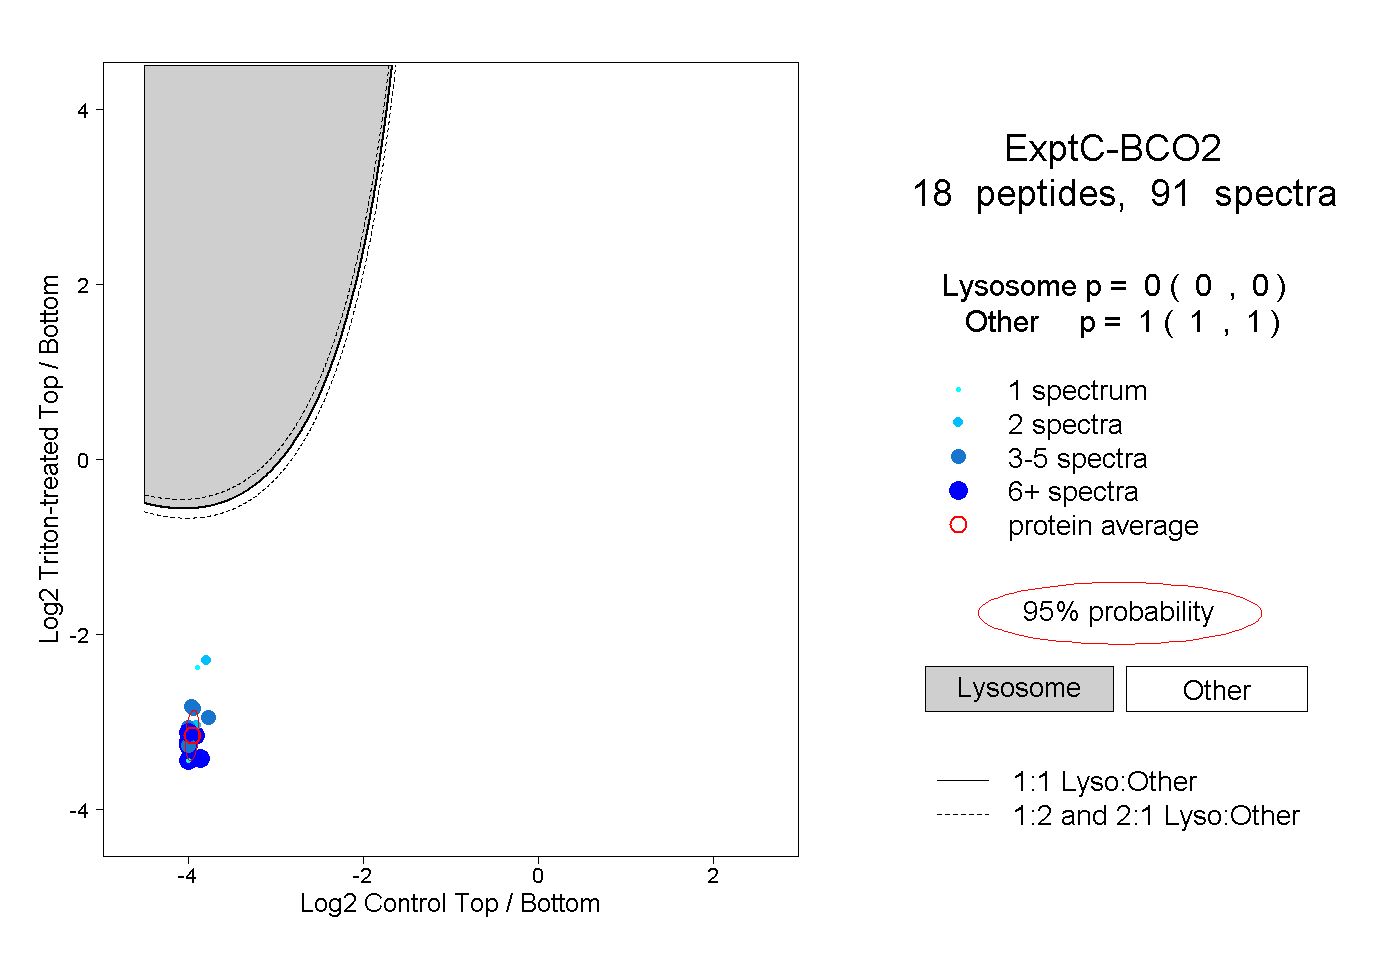 |
0.000 0.000 | 0.000 |
1.000 1.000 | 1.000 |
||||||||
| Plot | Lyso | Other | |||||||||||
| Expt D |
5 peptides |
12 spectra |
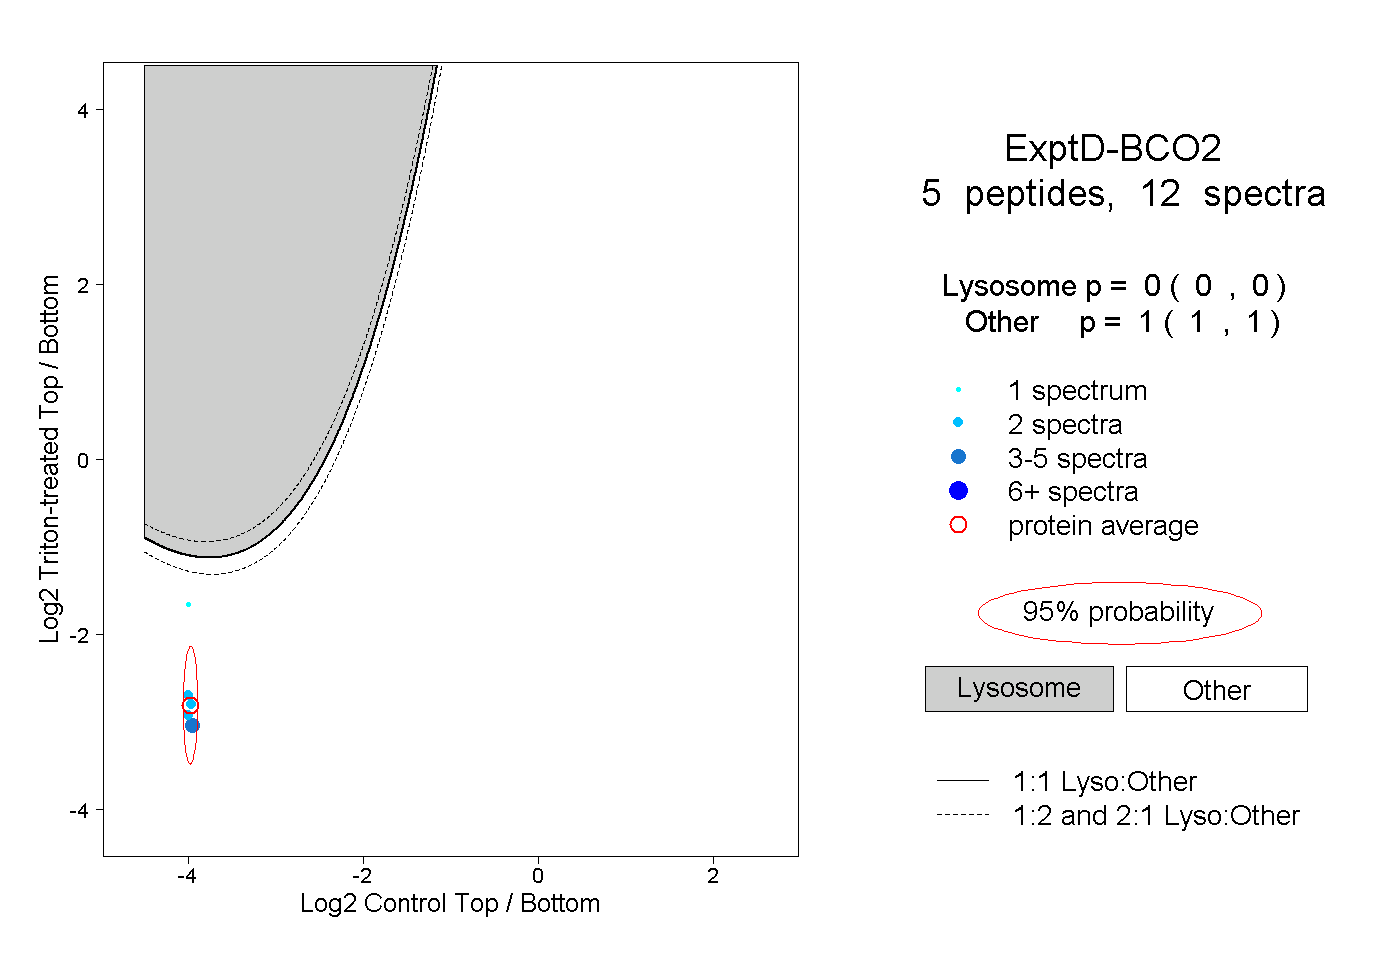 |
0.000 0.000 | 0.000 |
1.000 1.000 | 1.000 |