 2
2peptides
spectra
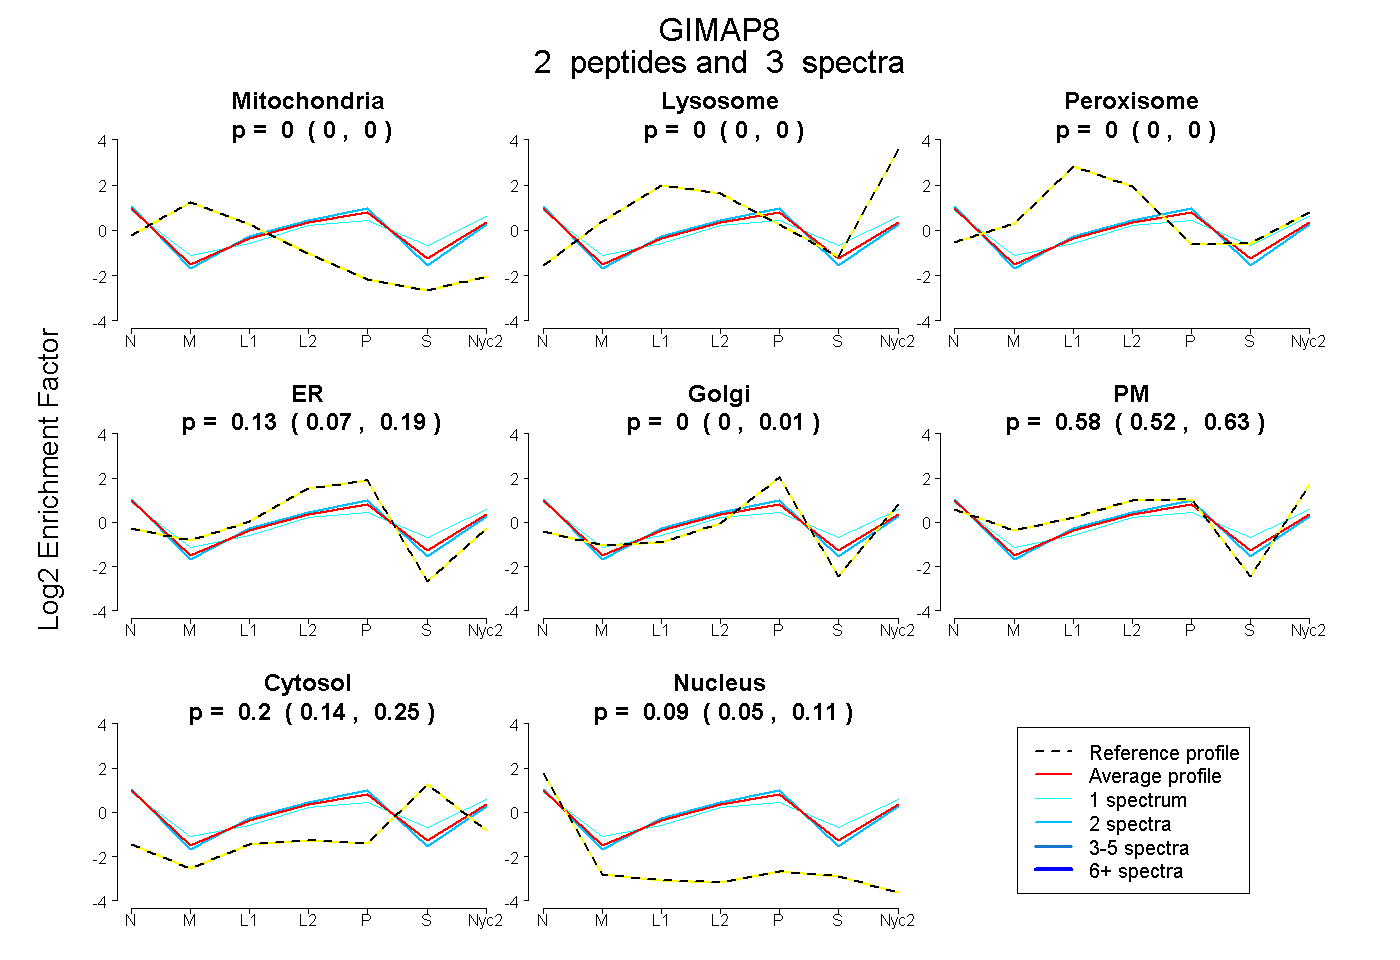
0.000 | 0.000
0.000 | 0.000
0.000 | 0.000
0.070 | 0.188
0.000 | 0.014
0.517 | 0.628
0.141 | 0.254
0.051 | 0.115
3peptides
spectra
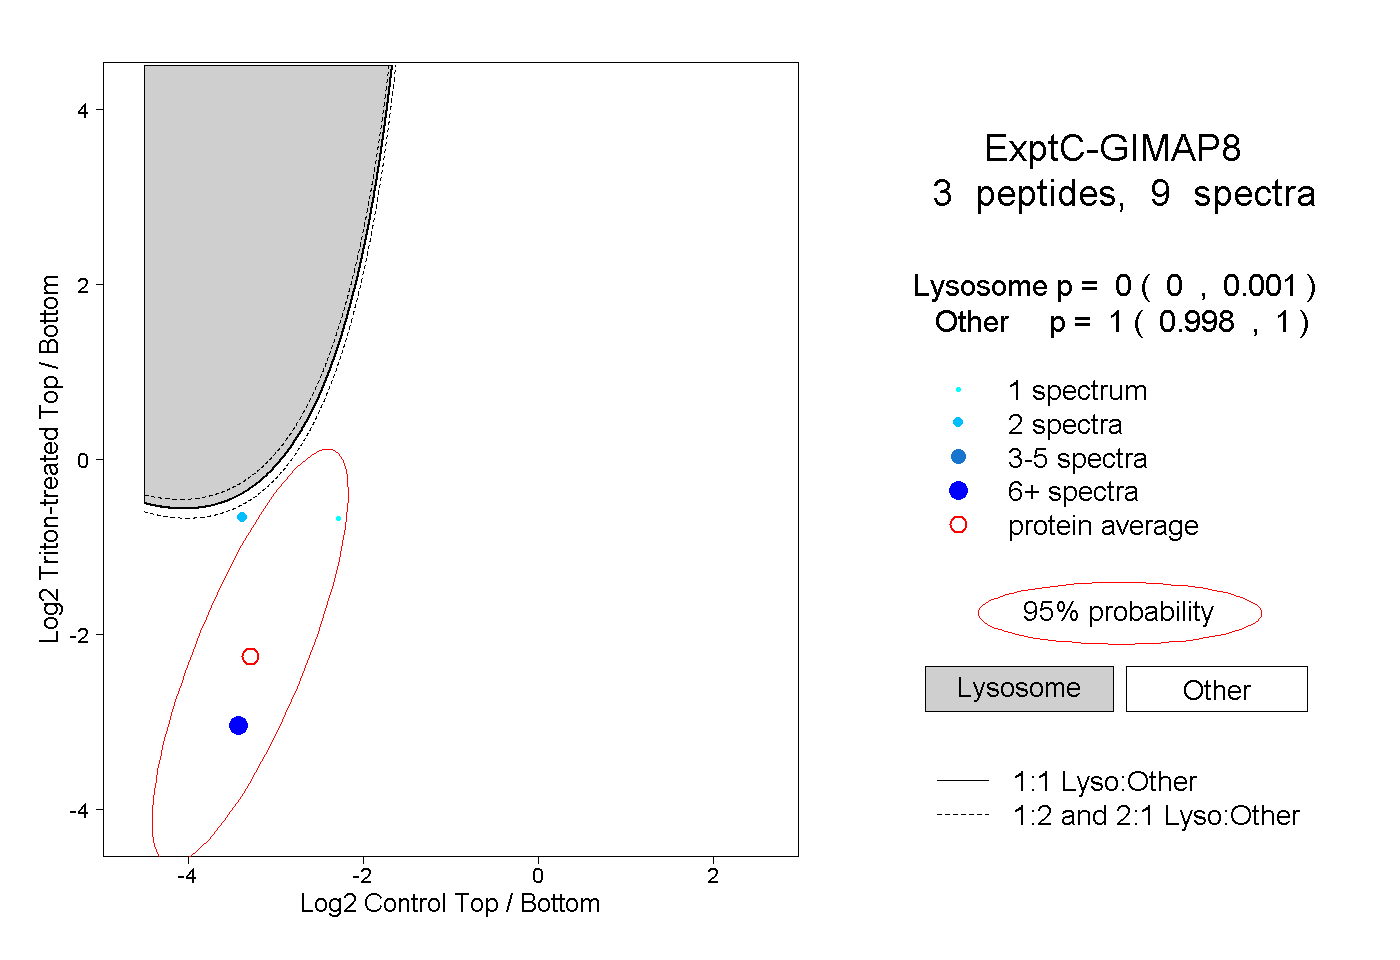
0.000 | 0.001
0.998 | 1.000
1peptide
spectrum
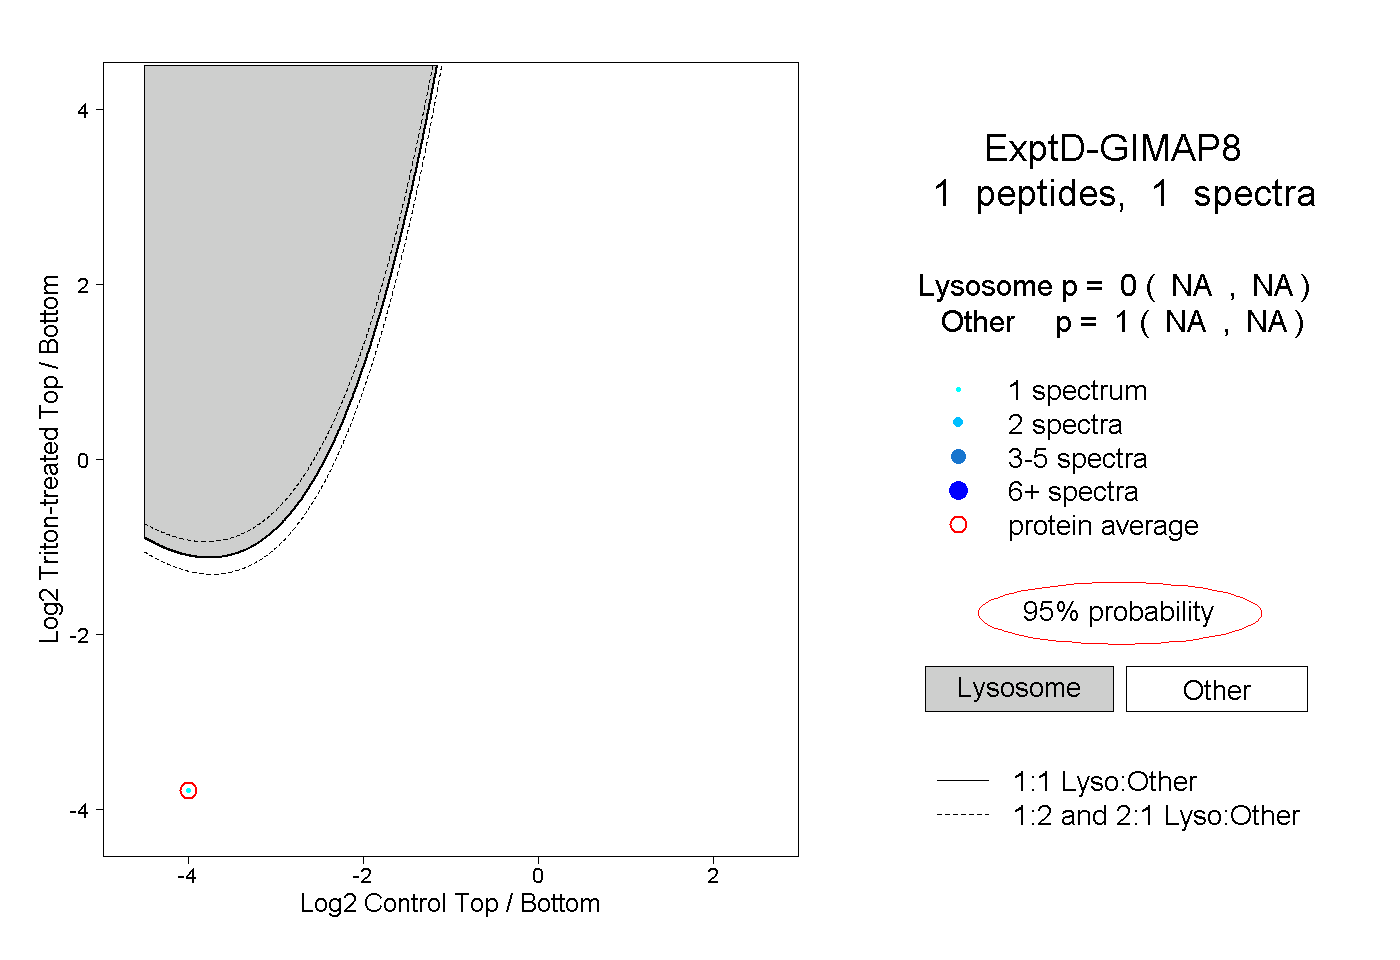
NA | NA
NA | NA