 9
9peptides
spectra
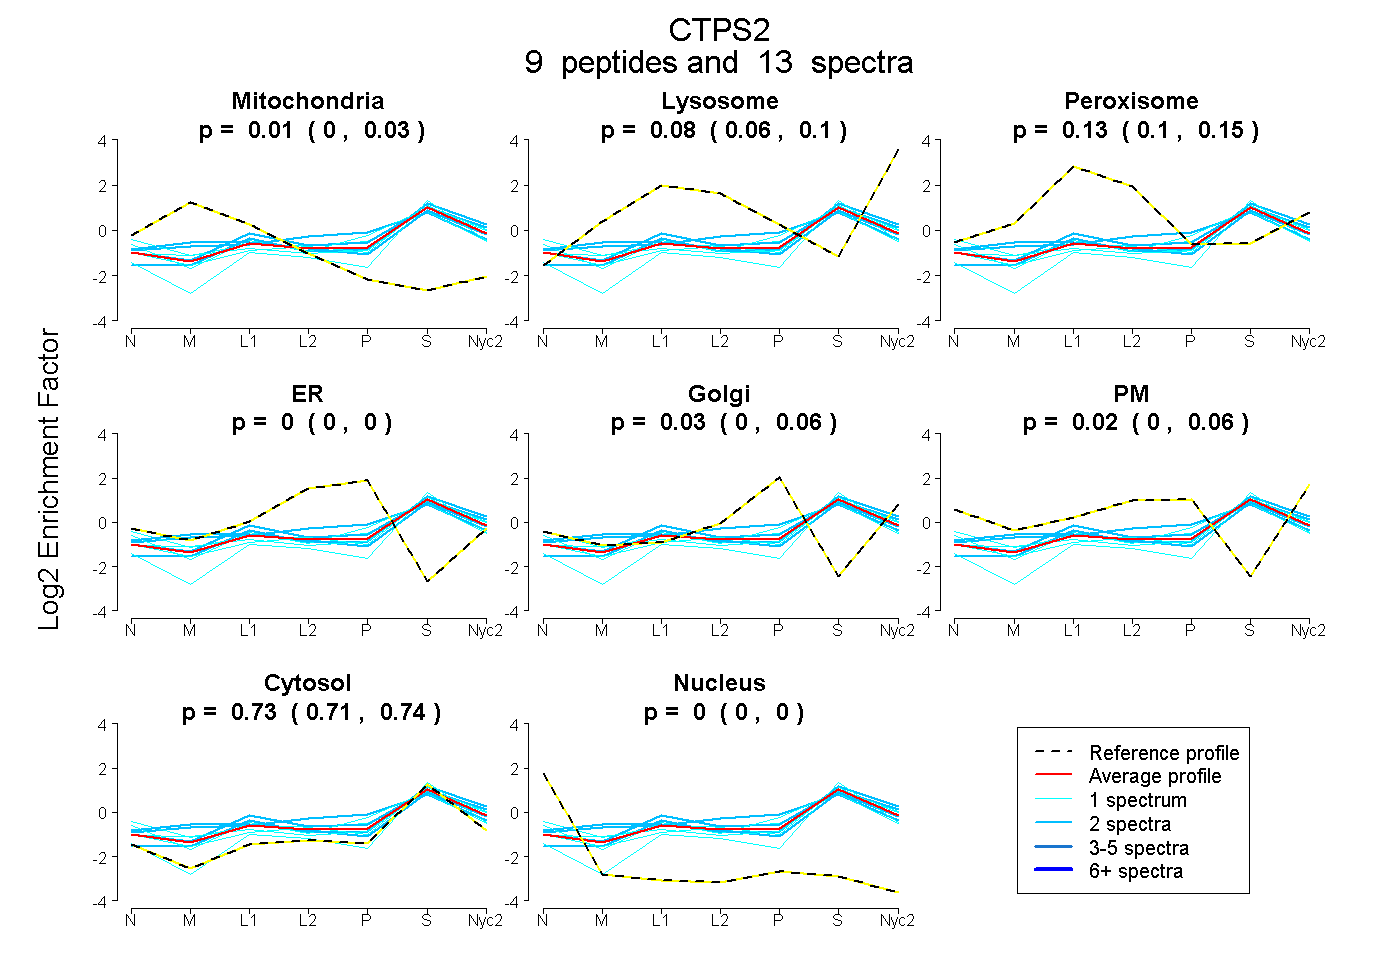
0.000 | 0.026
0.057 | 0.105
0.105 | 0.148
0.000 | 0.000
0.000 | 0.058
0.000 | 0.059
0.714 | 0.742
0.000 | 0.000
1peptide
spectrum
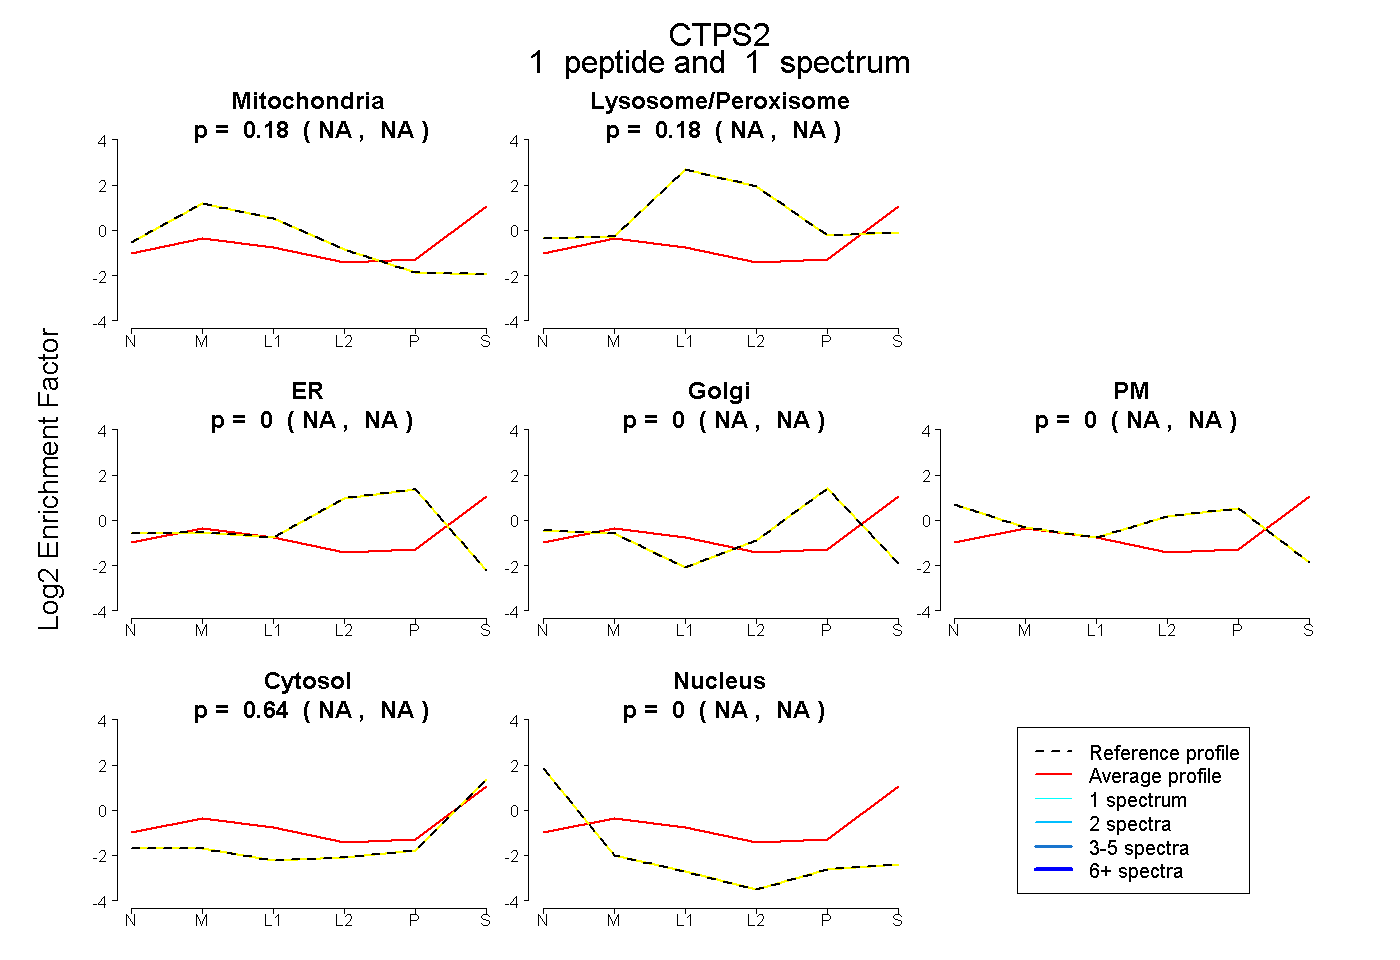
NA | NA
NA | NA
NA | NA
NA | NA
NA | NA
NA | NA
NA | NA
11peptides
spectra
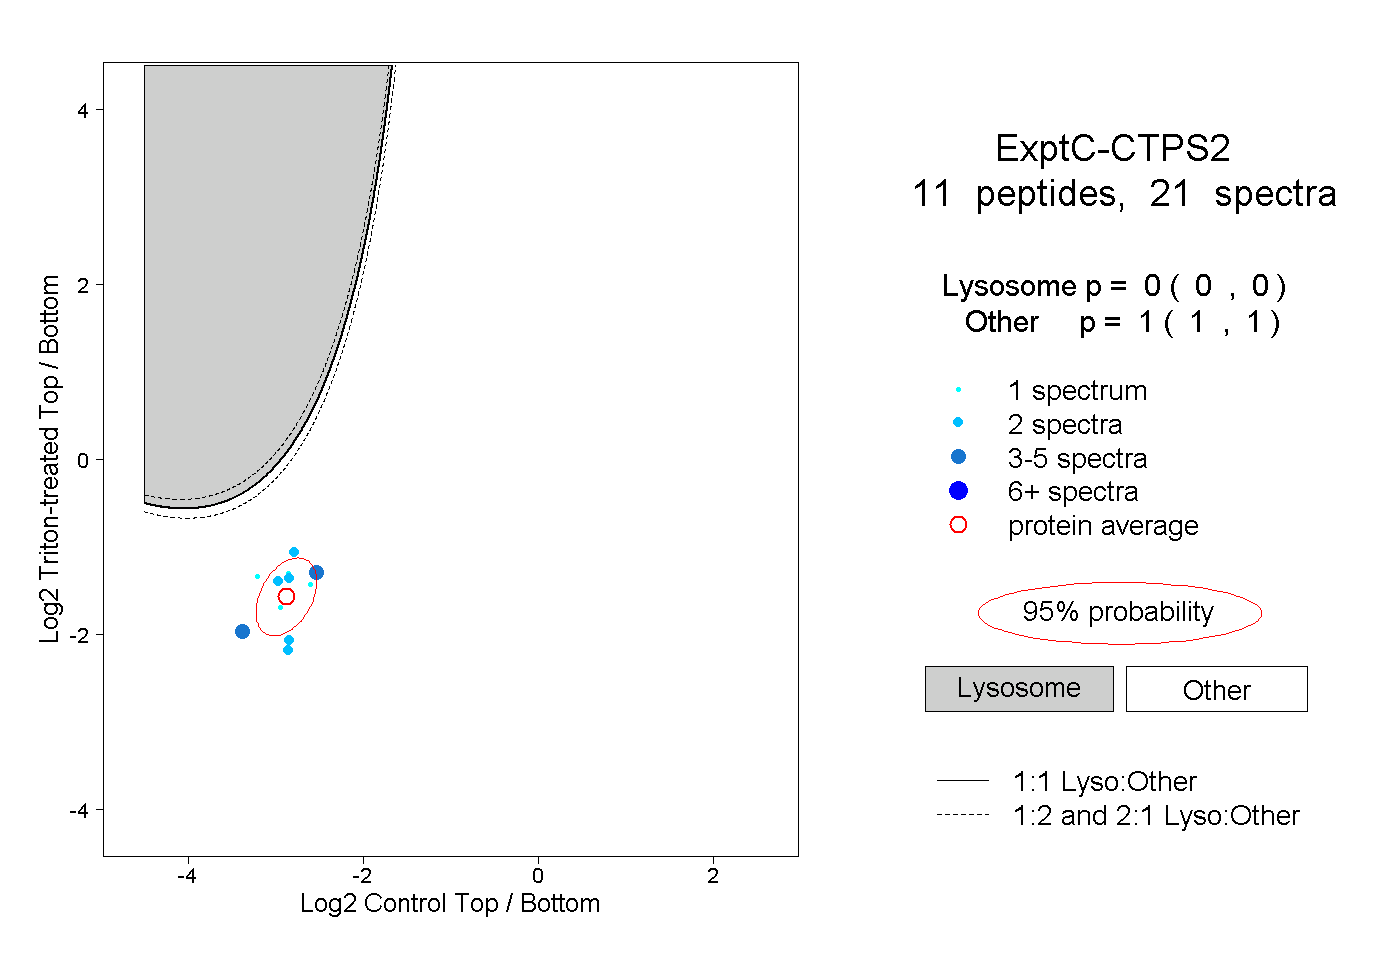
0.000 | 0.000
1.000 | 1.000
2peptides
spectra
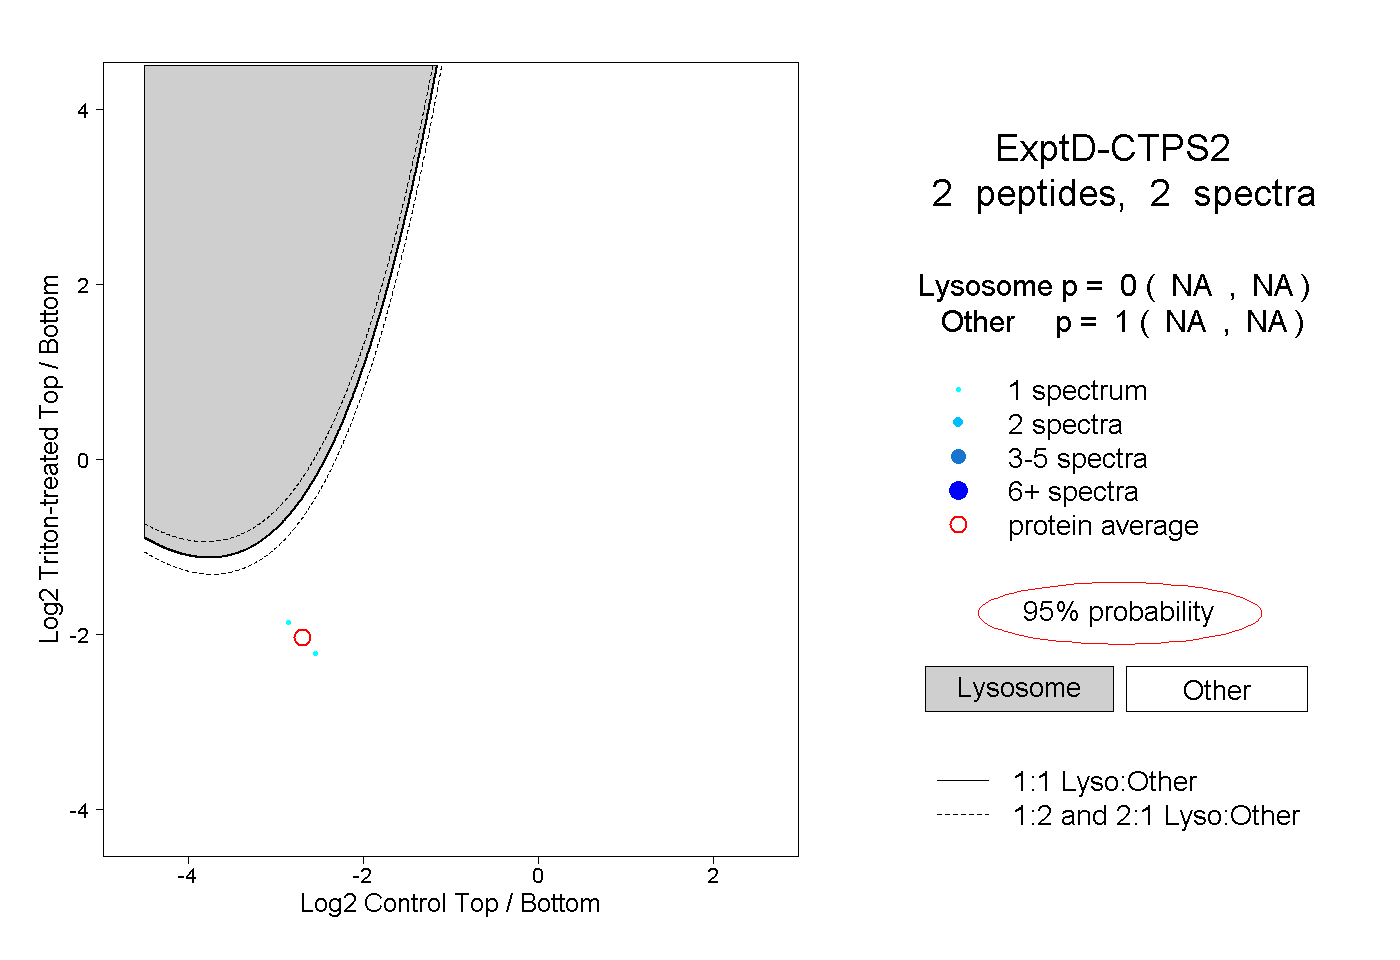
NA | NA
NA | NA