 5
5peptides
spectra
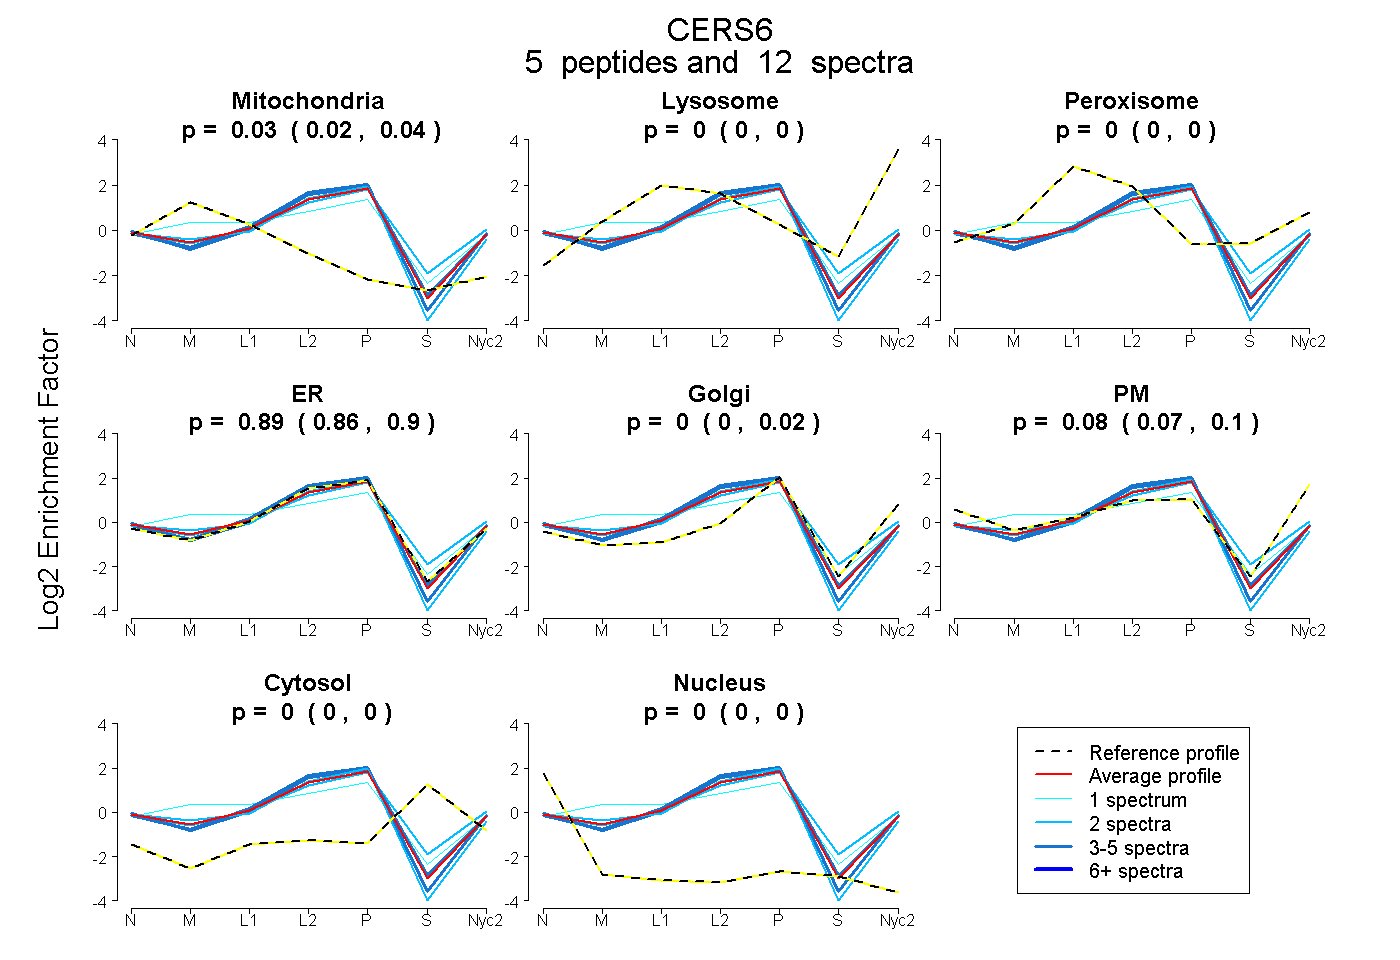
0.018 | 0.040
0.000 | 0.000
0.000 | 0.000
0.857 | 0.905
0.000 | 0.017
0.066 | 0.099
0.000 | 0.000
0.000 | 0.000
4peptides
spectra
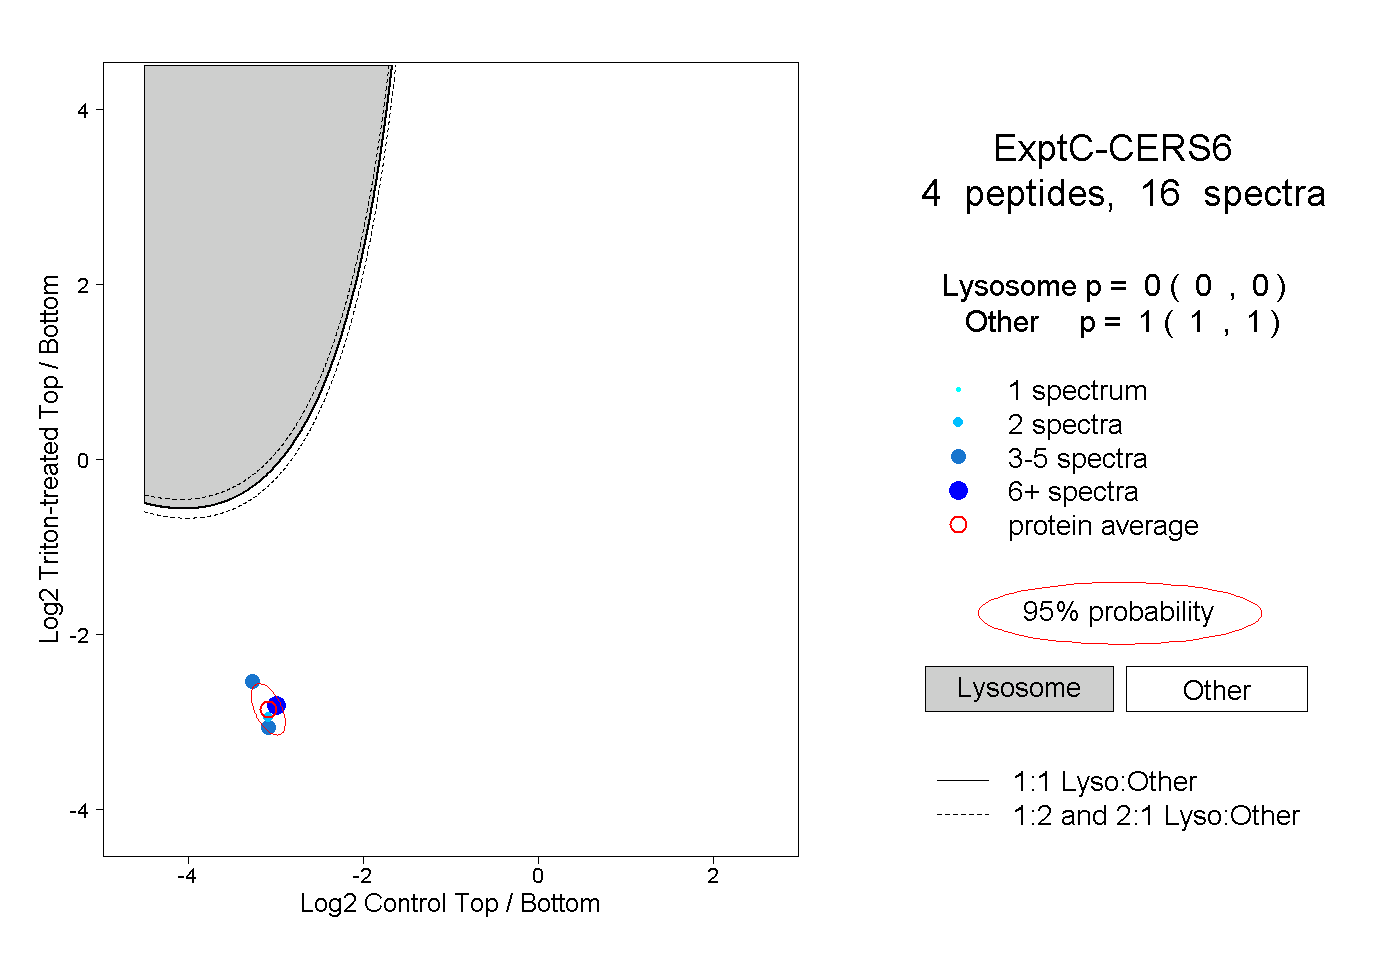
0.000 | 0.000
1.000 | 1.000
1peptide
spectrum
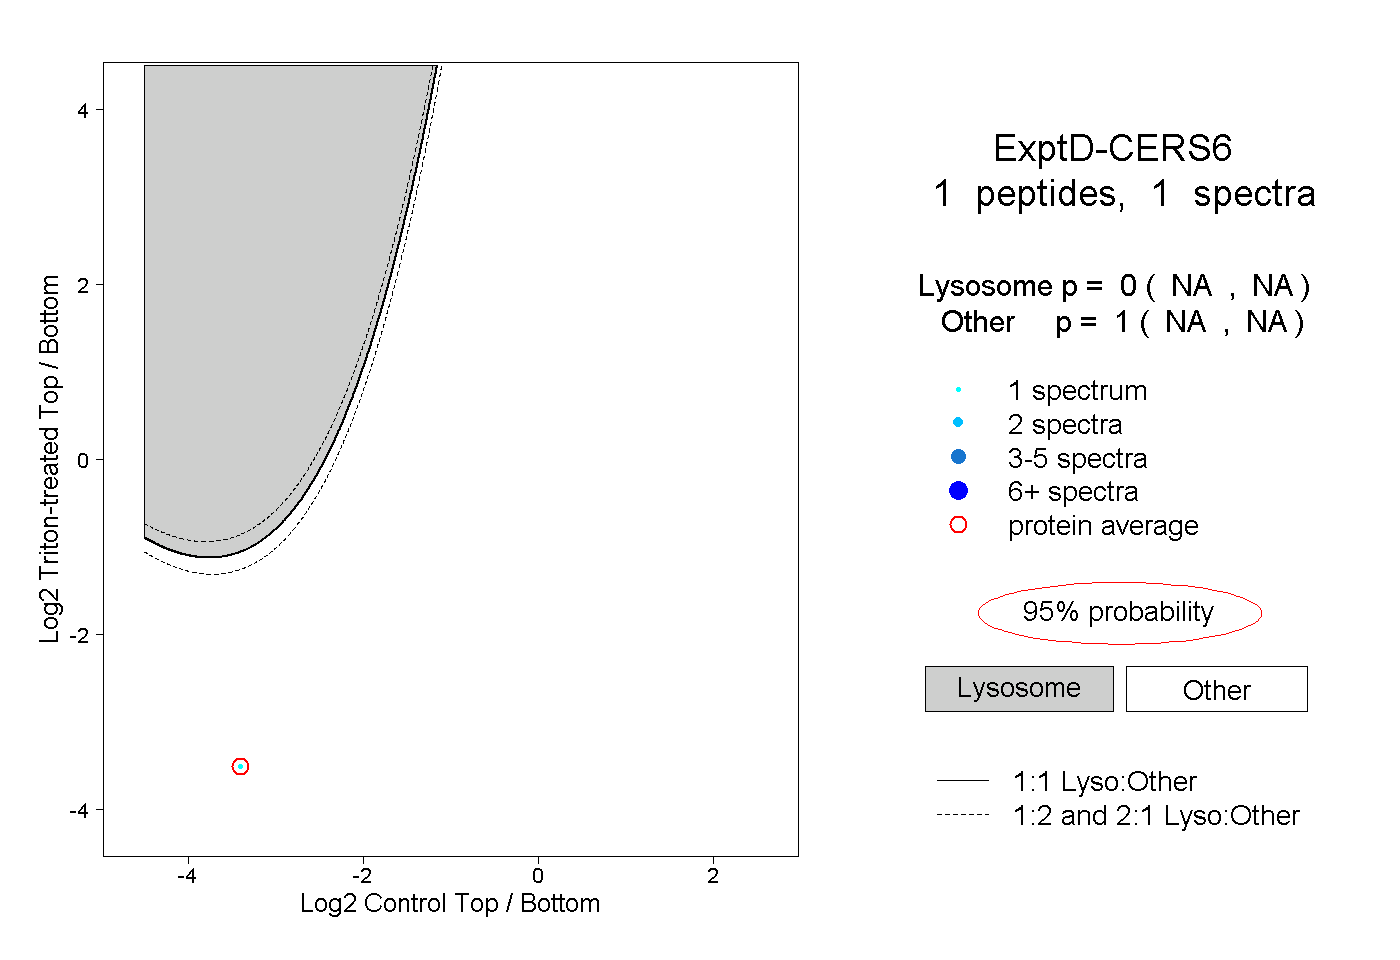
NA | NA
NA | NA