TTC39B
[ENSRNOP00000055409]
Main page
| | | Plot |
Mito |
Lyso |
|
Perox |
ER |
Golgi |
PM |
Cytosol |
Nucleus |
|
| Expt A |
 14
14
peptides |
35
spectra |
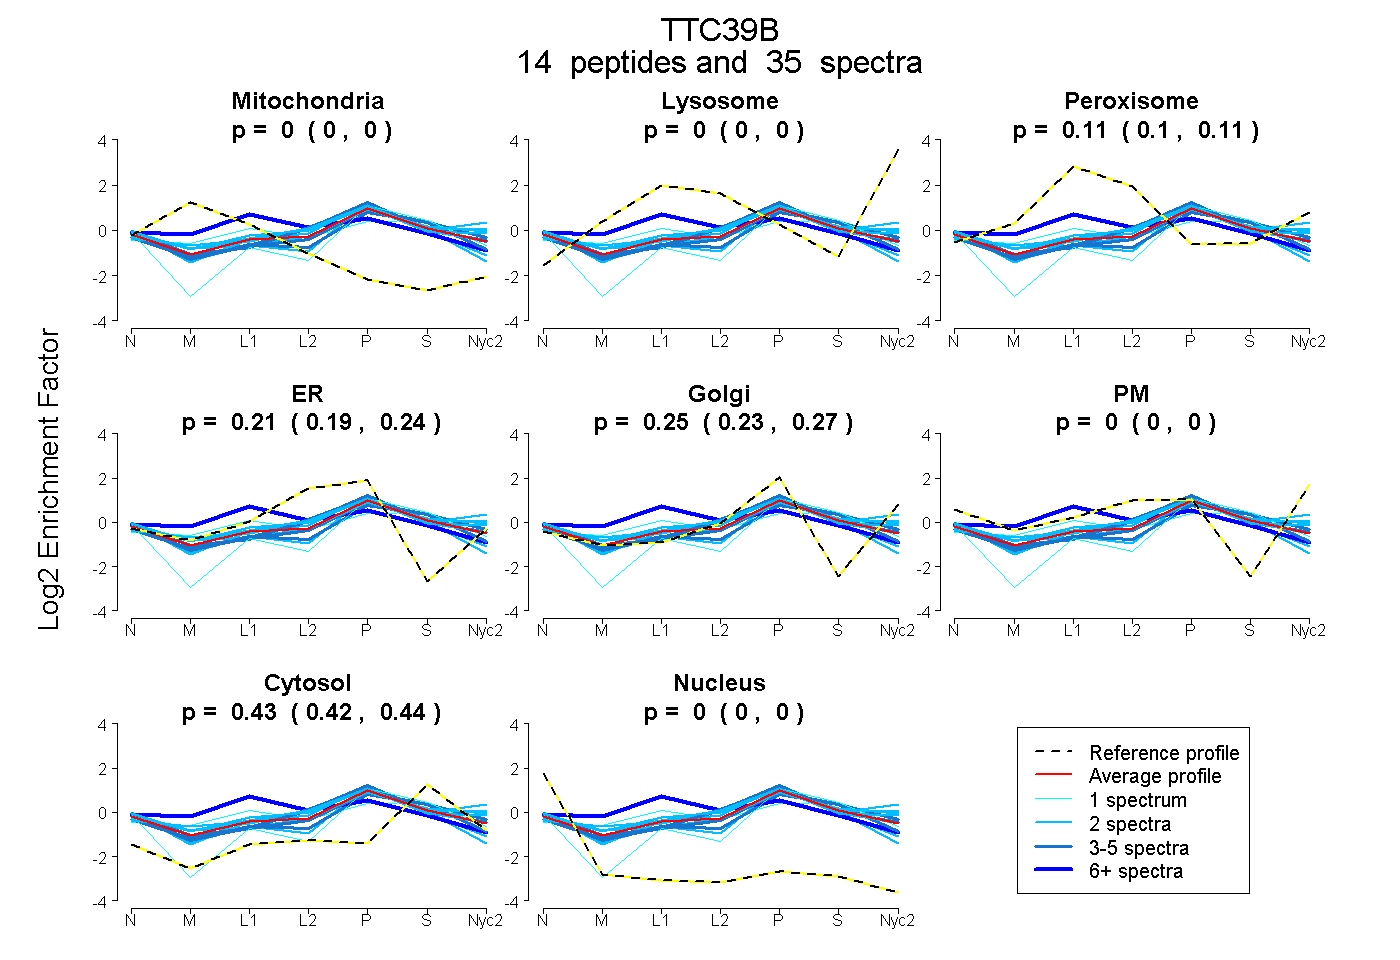 |
0.000
0.000 | 0.000 |
0.000
0.000 | 0.000 |
|
0.106
0.096 | 0.115 |
0.214
0.189 | 0.235 |
0.250
0.227 | 0.270 |
0.000
0.000 | 0.000 |
0.430
0.422 | 0.435 |
0.000
0.000 | 0.000 |
|
| | | Plot |
Mito |
|
Lyso or Perox |
|
ER |
Golgi |
PM |
Cytosol |
Nucleus |
|
| Expt B |
4
peptides |
8
spectra |
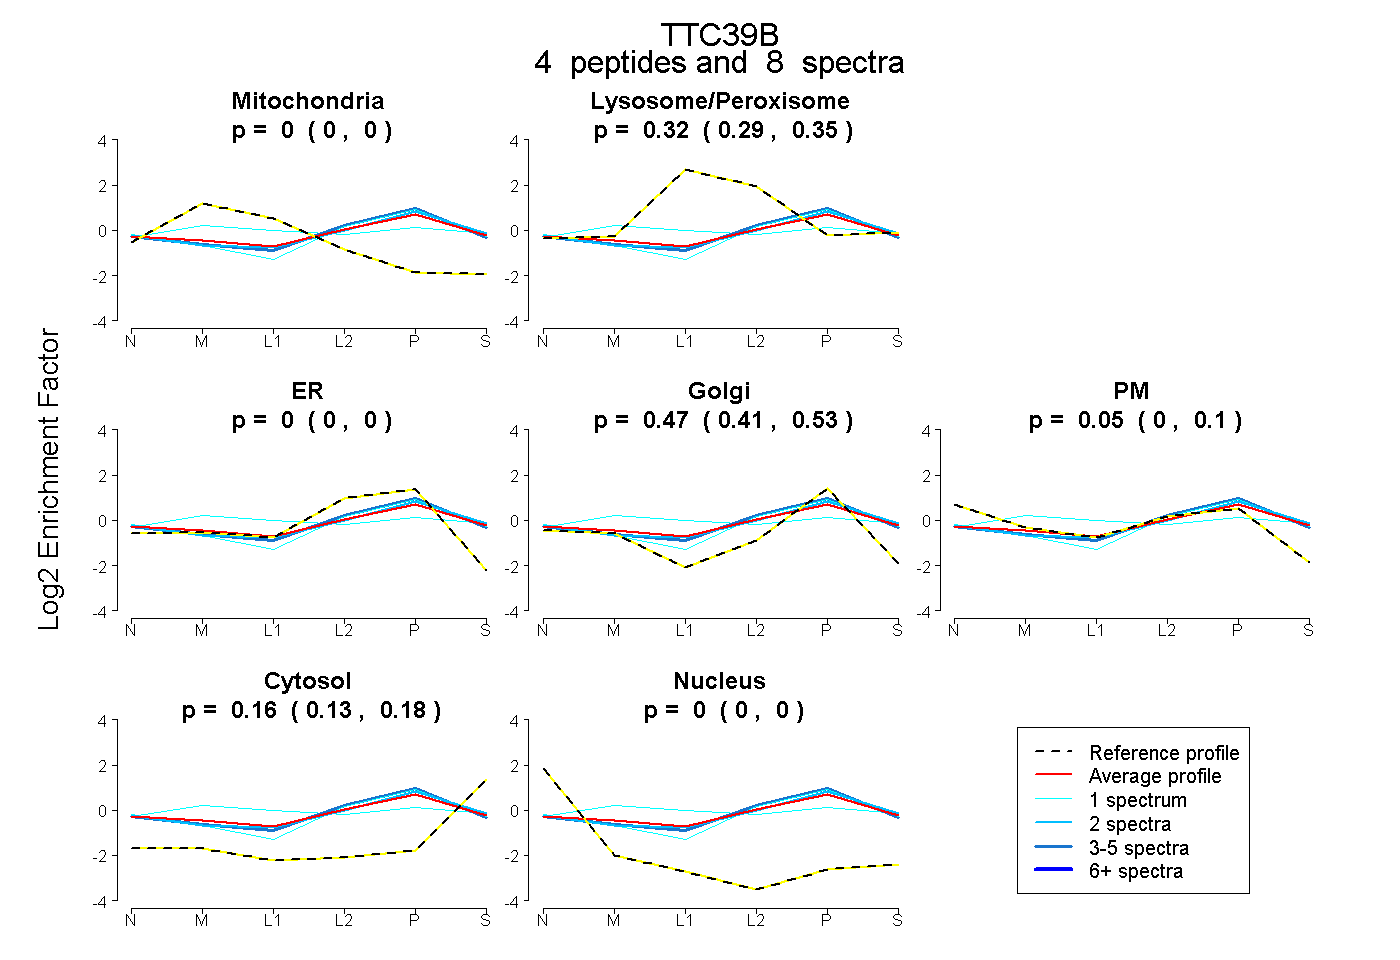 |
0.000
0.000 | 0.000 |
|
0.320
0.287 | 0.350 |
|
0.000
0.000 | 0.000 |
0.474
0.406 | 0.525 |
0.050
0.000 | 0.102 |
0.157
0.130 | 0.178 |
0.000
0.000 | 0.000 |
|
| | | Plot |
|
Lyso |
|
|
|
|
|
|
|
Other |
| Expt C |
12
peptides |
33
spectra |
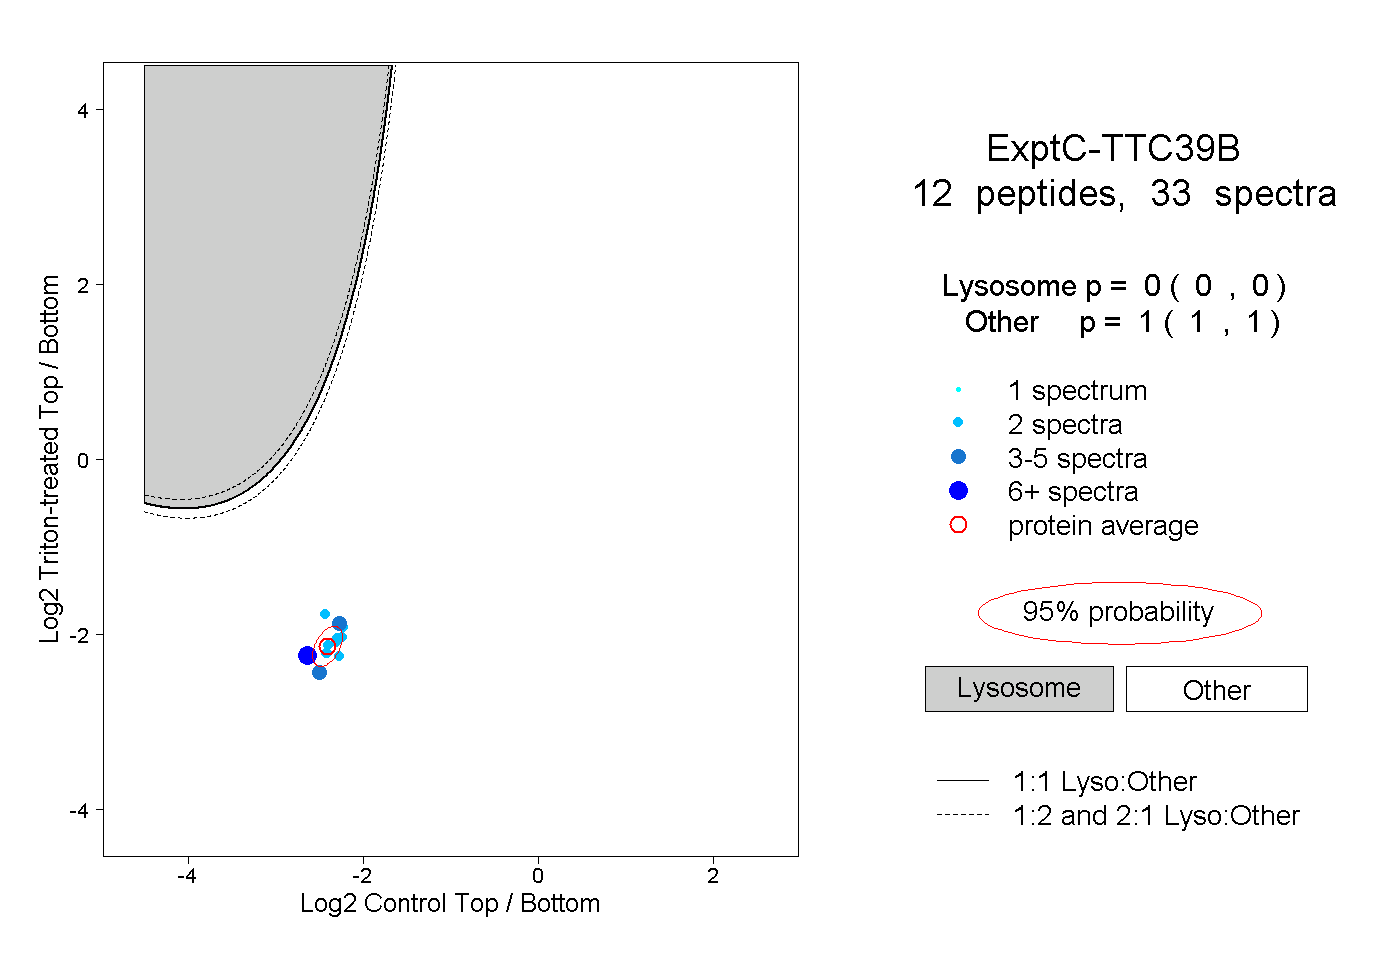 |
|
0.000
0.000 | 0.000 |
|
|
|
|
|
|
|
1.000
1.000 | 1.000 |
| 2 spectra, QVDGLK |
|
0.000 |
|
|
|
|
|
|
|
1.000 |
| 2 spectra, YSPSSGVPGK |
|
0.000 |
|
|
|
|
|
|
|
1.000 |
| 6 spectra, DLGLLQLR |
|
0.000 |
|
|
|
|
|
|
|
1.000 |
| 2 spectra, ATYVFLK |
|
0.000 |
|
|
|
|
|
|
|
1.000 |
| 2 spectra, TSYQIYK |
|
0.000 |
|
|
|
|
|
|
|
1.000 |
| 4 spectra, SQGEIDK |
|
0.000 |
|
|
|
|
|
|
|
1.000 |
| 5 spectra, AEGSSAK |
|
0.000 |
|
|
|
|
|
|
|
1.000 |
| 2 spectra, AQETFR |
|
0.000 |
|
|
|
|
|
|
|
1.000 |
| 2 spectra, ENVVSLFR |
|
0.000 |
|
|
|
|
|
|
|
1.000 |
| 2 spectra, DYSLESR |
|
0.000 |
|
|
|
|
|
|
|
1.000 |
| 2 spectra, LLEFIGFSGNR |
|
0.000 |
|
|
|
|
|
|
|
1.000 |
| 2 spectra, SLPTEK |
|
0.000 |
|
|
|
|
|
|
|
1.000 |
| | | Plot |
|
Lyso |
|
|
|
|
|
|
|
Other |
| Expt D |
2
peptides |
3
spectra |
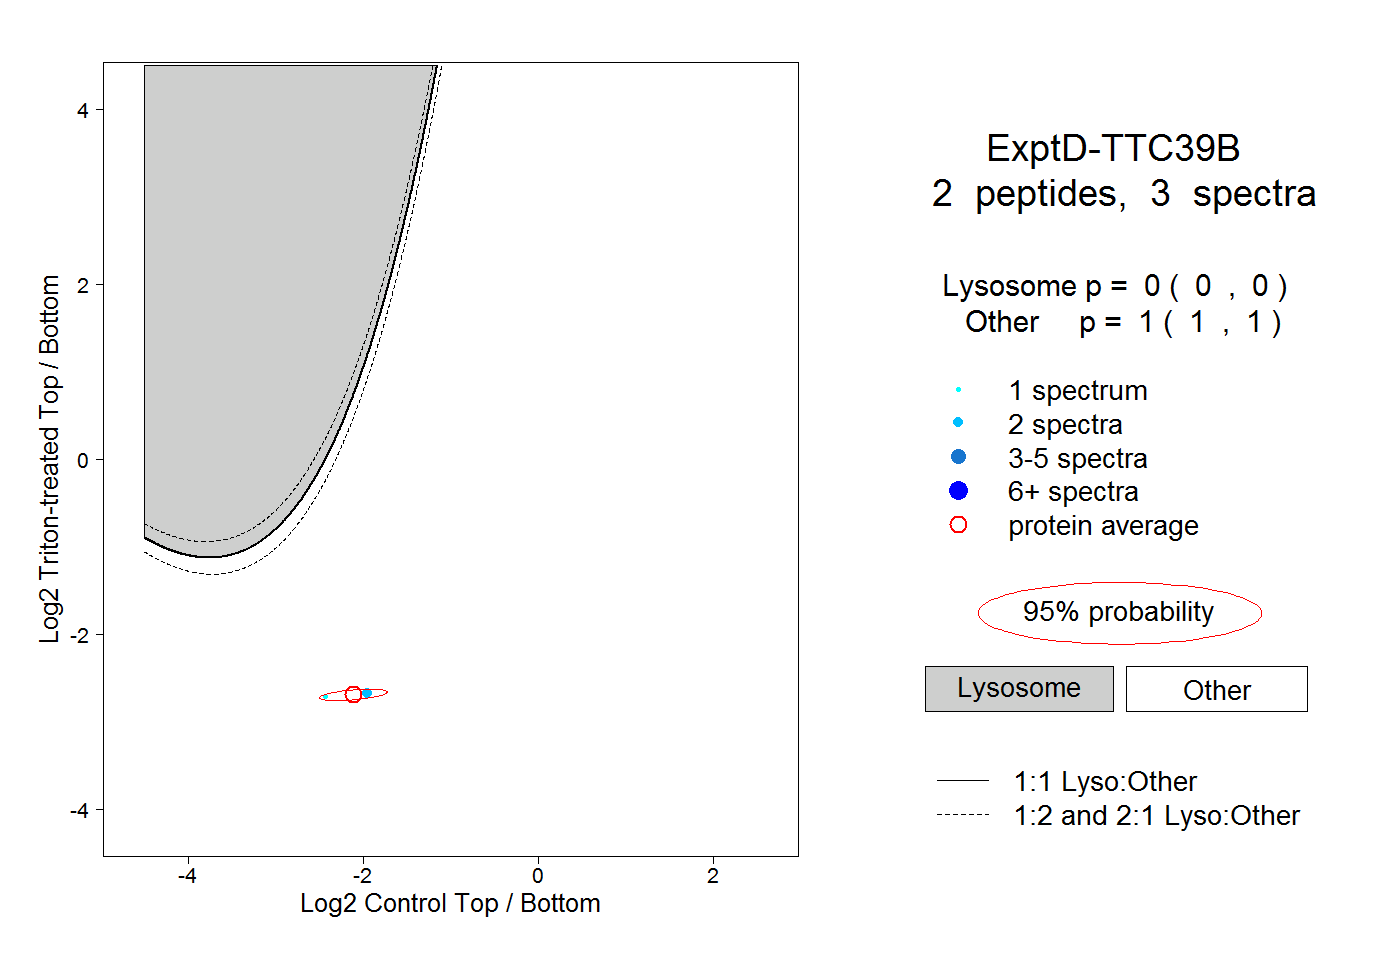 |
|
0.000
0.000 | 0.000 |
|
|
|
|
|
|
|
1.000
1.000 | 1.000 |