LARP4B
[ENSRNOP00000055347]
Main page
| | | Plot |
Mito |
Lyso |
|
Perox |
ER |
Golgi |
PM |
Cytosol |
Nucleus |
|
| Expt A |
 13
13
peptides |
24
spectra |
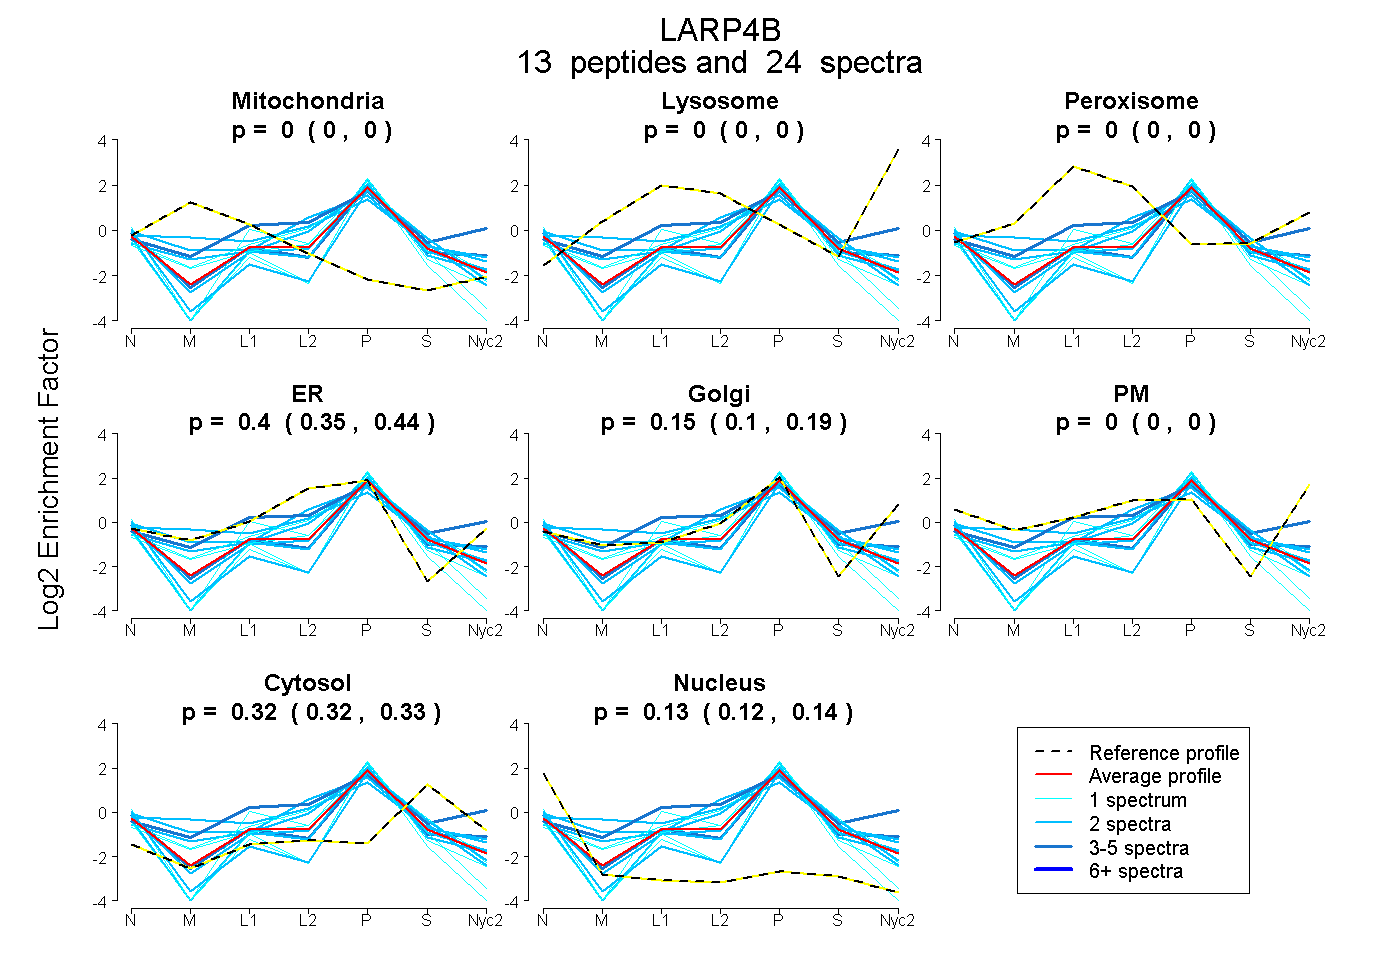 |
0.000
0.000 | 0.000 |
0.000
0.000 | 0.000 |
|
0.000
0.000 | 0.000 |
0.399
0.353 | 0.438 |
0.150
0.100 | 0.194 |
0.000
0.000 | 0.000 |
0.325
0.315 | 0.332 |
0.127
0.115 | 0.135 |
|
| | | Plot |
Mito |
|
Lyso or Perox |
|
ER |
Golgi |
PM |
Cytosol |
Nucleus |
|
| Expt B |
6
peptides |
9
spectra |
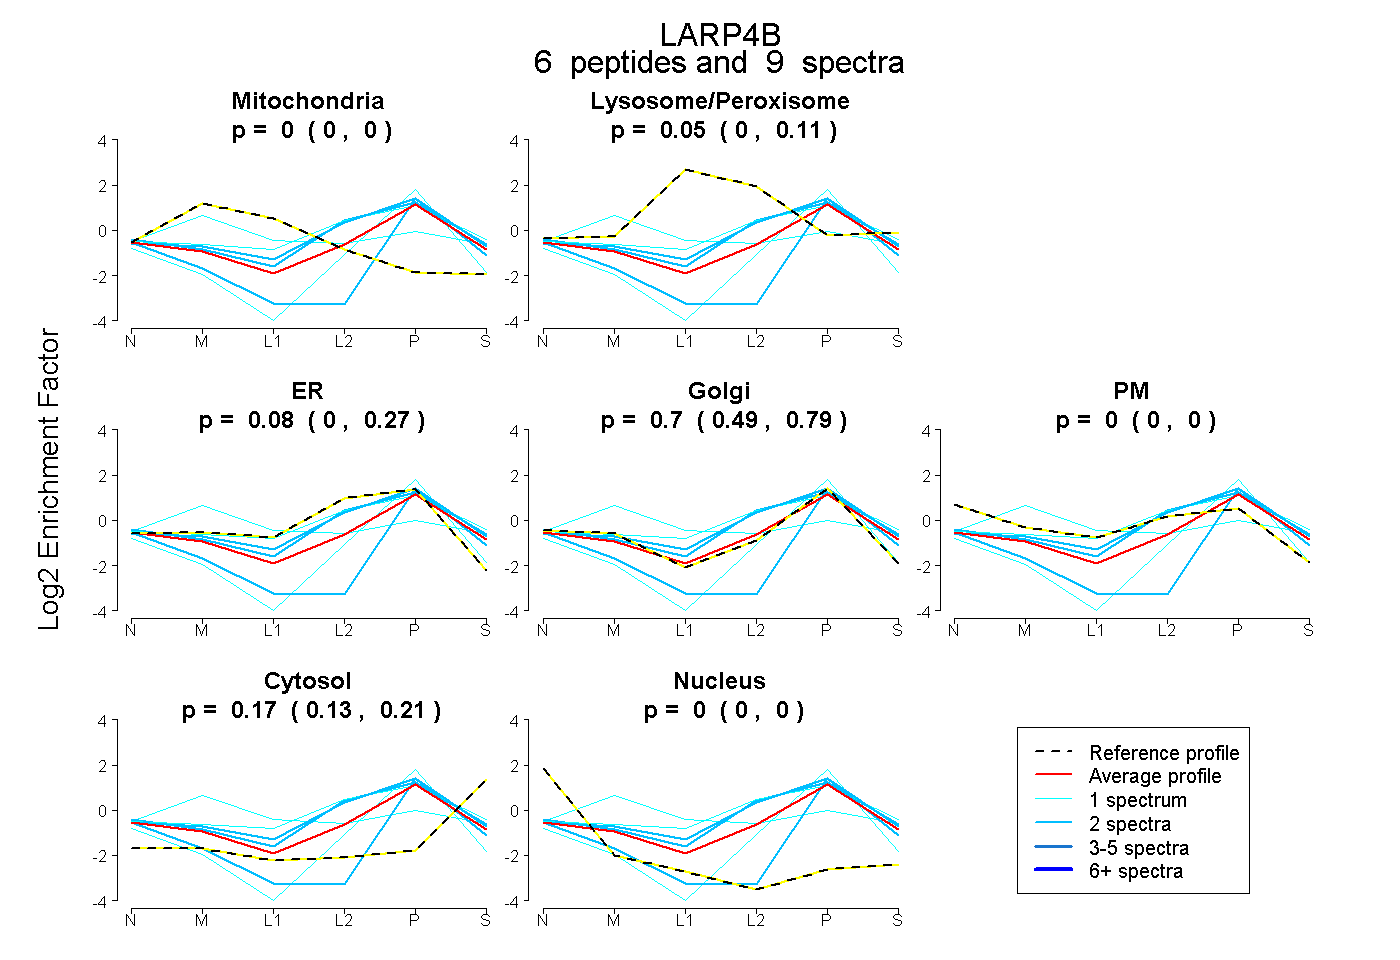 |
0.000
0.000 | 0.000 |
|
0.049
0.000 | 0.111 |
|
0.077
0.000 | 0.275 |
0.702
0.487 | 0.794 |
0.000
0.000 | 0.000 |
0.172
0.131 | 0.209 |
0.000
0.000 | 0.000 |
|
| 2 spectra, CIVILR |
0.000 |
|
0.013 |
|
0.610 |
0.167 |
0.000 |
0.210 |
0.000 |
|
| 1 spectrum, AEDLFENR |
0.000 |
|
0.000 |
|
0.000 |
0.940 |
0.000 |
0.047 |
0.014 |
|
| 1 spectrum, TFQGKPIK |
0.000 |
|
0.252 |
|
0.256 |
0.356 |
0.000 |
0.136 |
0.000 |
|
| 1 spectrum, AIAINTFLPK |
0.325 |
|
0.189 |
|
0.000 |
0.360 |
0.000 |
0.125 |
0.000 |
|
| 2 spectra, VVAEPQAQR |
0.000 |
|
0.000 |
|
0.000 |
0.599 |
0.000 |
0.256 |
0.145 |
|
| 2 spectra, TLEFCLSR |
0.000 |
|
0.061 |
|
0.524 |
0.310 |
0.000 |
0.105 |
0.000 |
|
| | | Plot |
|
Lyso |
|
|
|
|
|
|
|
Other |
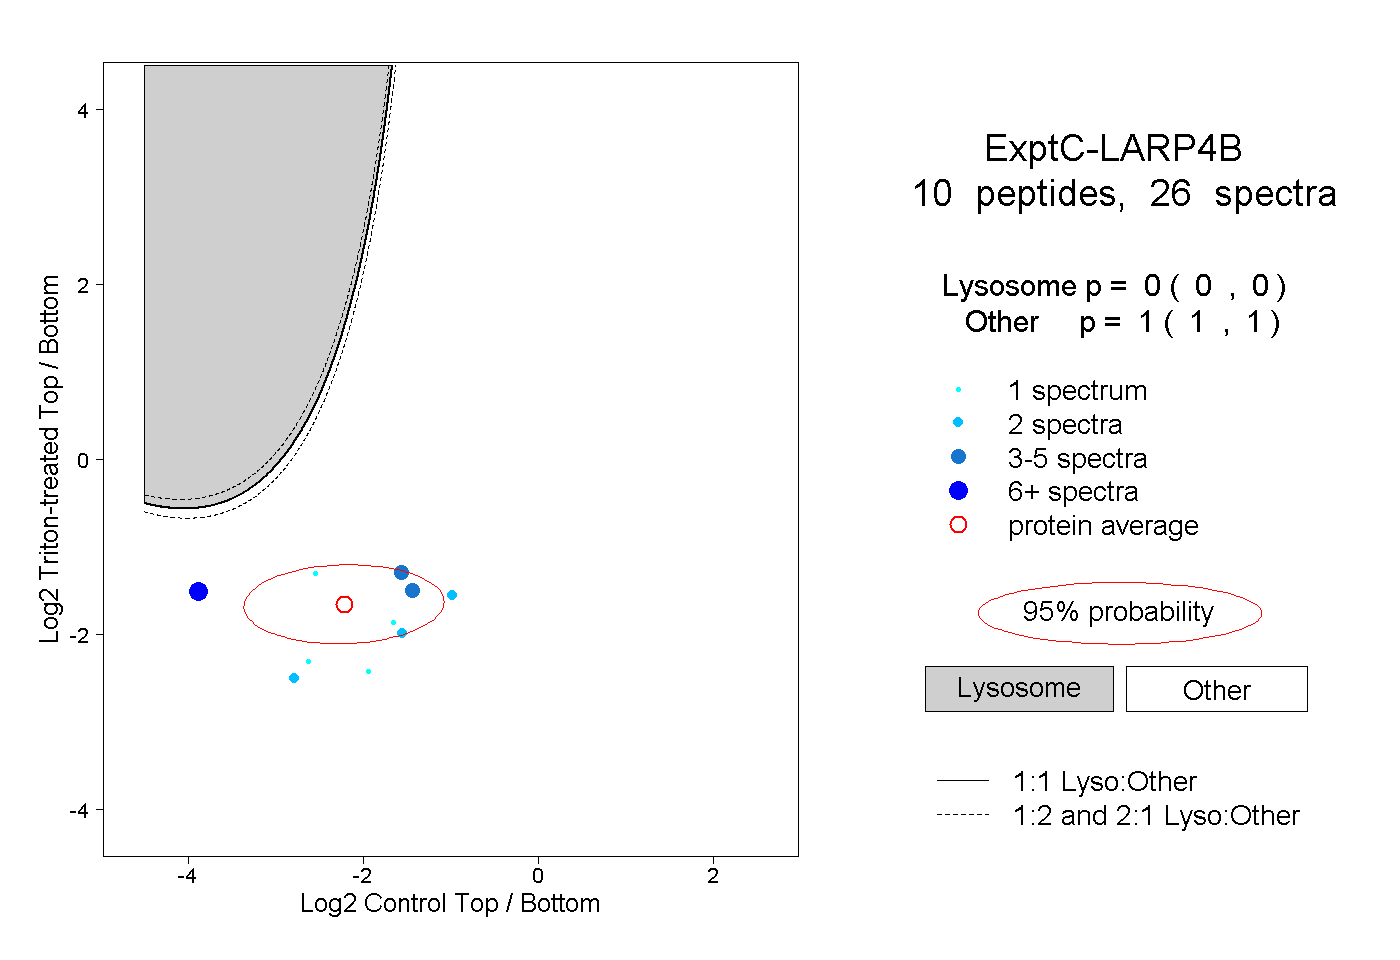
| Expt C |
10
peptides |
26
spectra |
 |
|
0.000
0.000 | 0.000 |
|
|
|
|
|
|
|
1.000
1.000 | 1.000 |
| | | Plot |
|
Lyso |
|
|
|
|
|
|
|
Other |
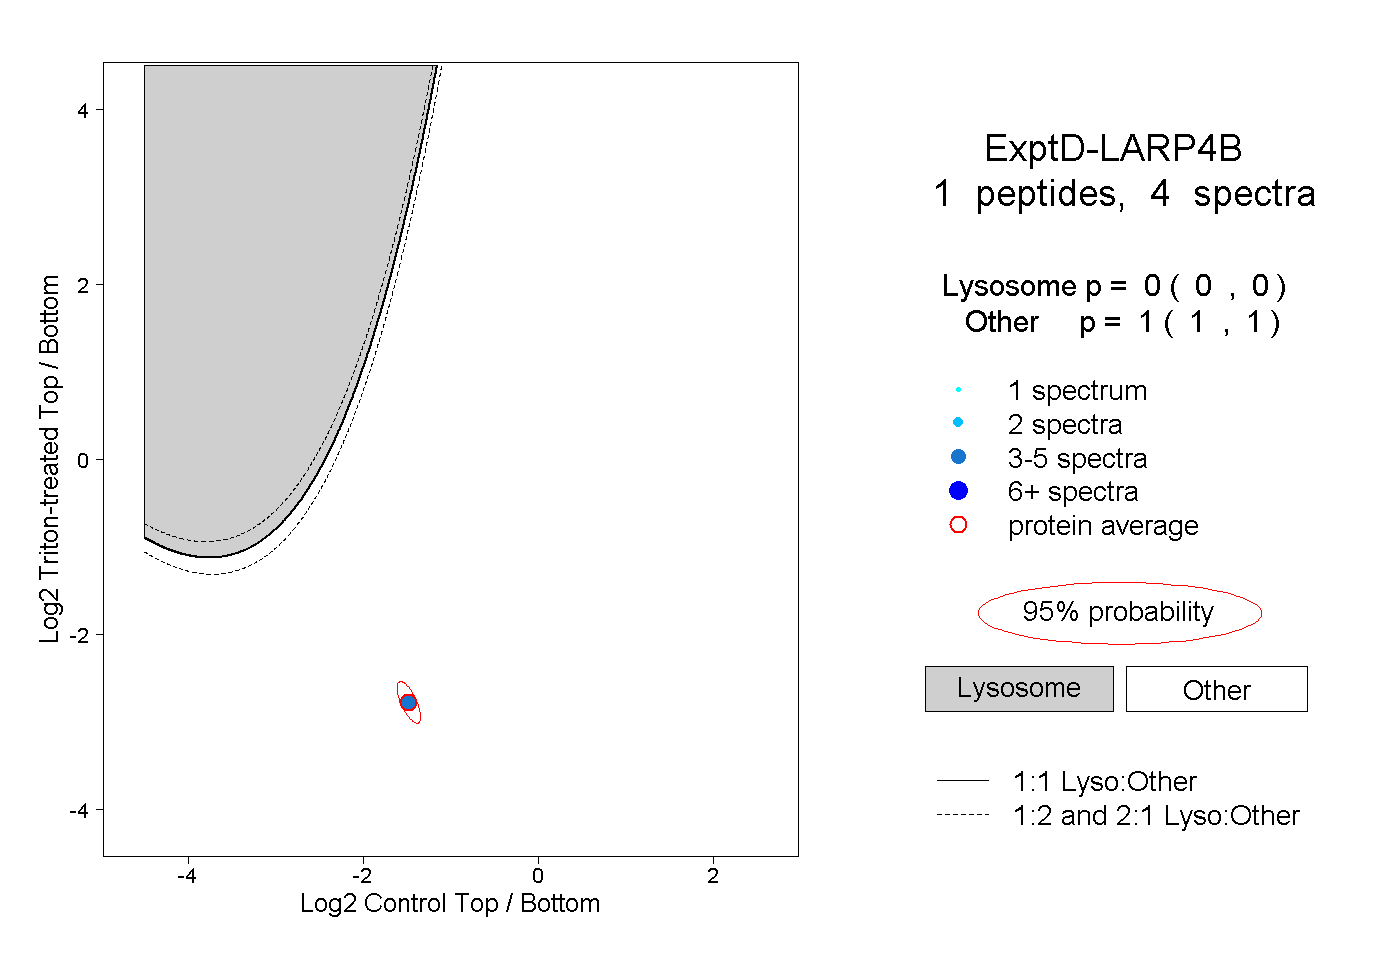
| Expt D |
1
peptide |
4
spectra |
 |
|
0.000
0.000 | 0.000 |
|
|
|
|
|
|
|
1.000
1.000 | 1.000 |