 27
27peptides
spectra
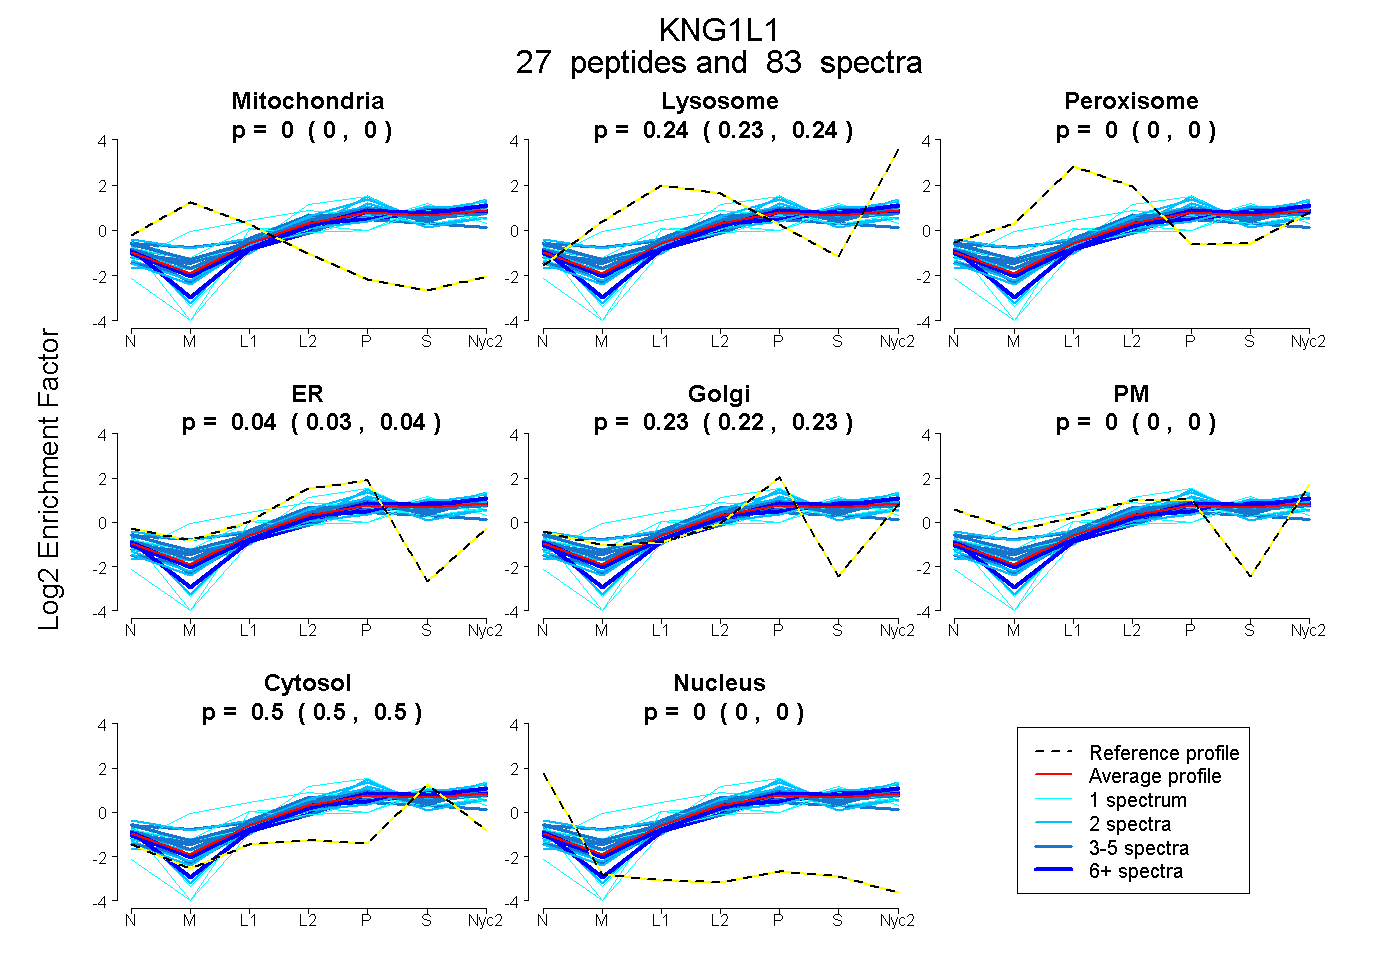
0.000 | 0.000
0.233 | 0.239
0.000 | 0.000
0.030 | 0.040
0.223 | 0.234
0.000 | 0.000
0.497 | 0.502
0.000 | 0.000
17peptides
spectra
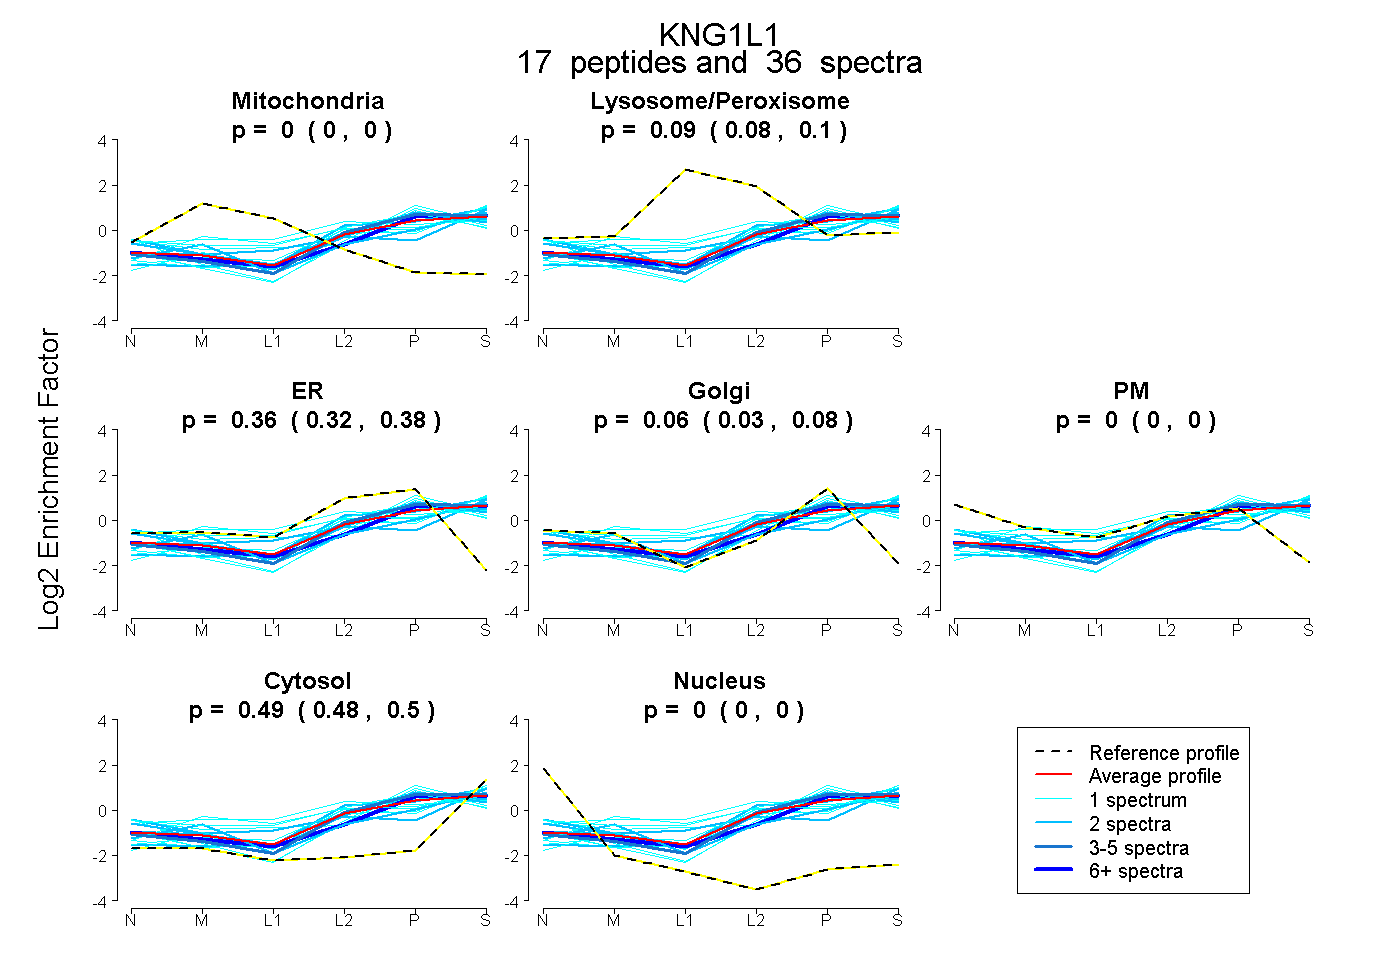
0.000 | 0.000
0.083 | 0.104
0.324 | 0.383
0.031 | 0.083
0.000 | 0.000
0.480 | 0.498
0.000 | 0.000
27peptides
spectra
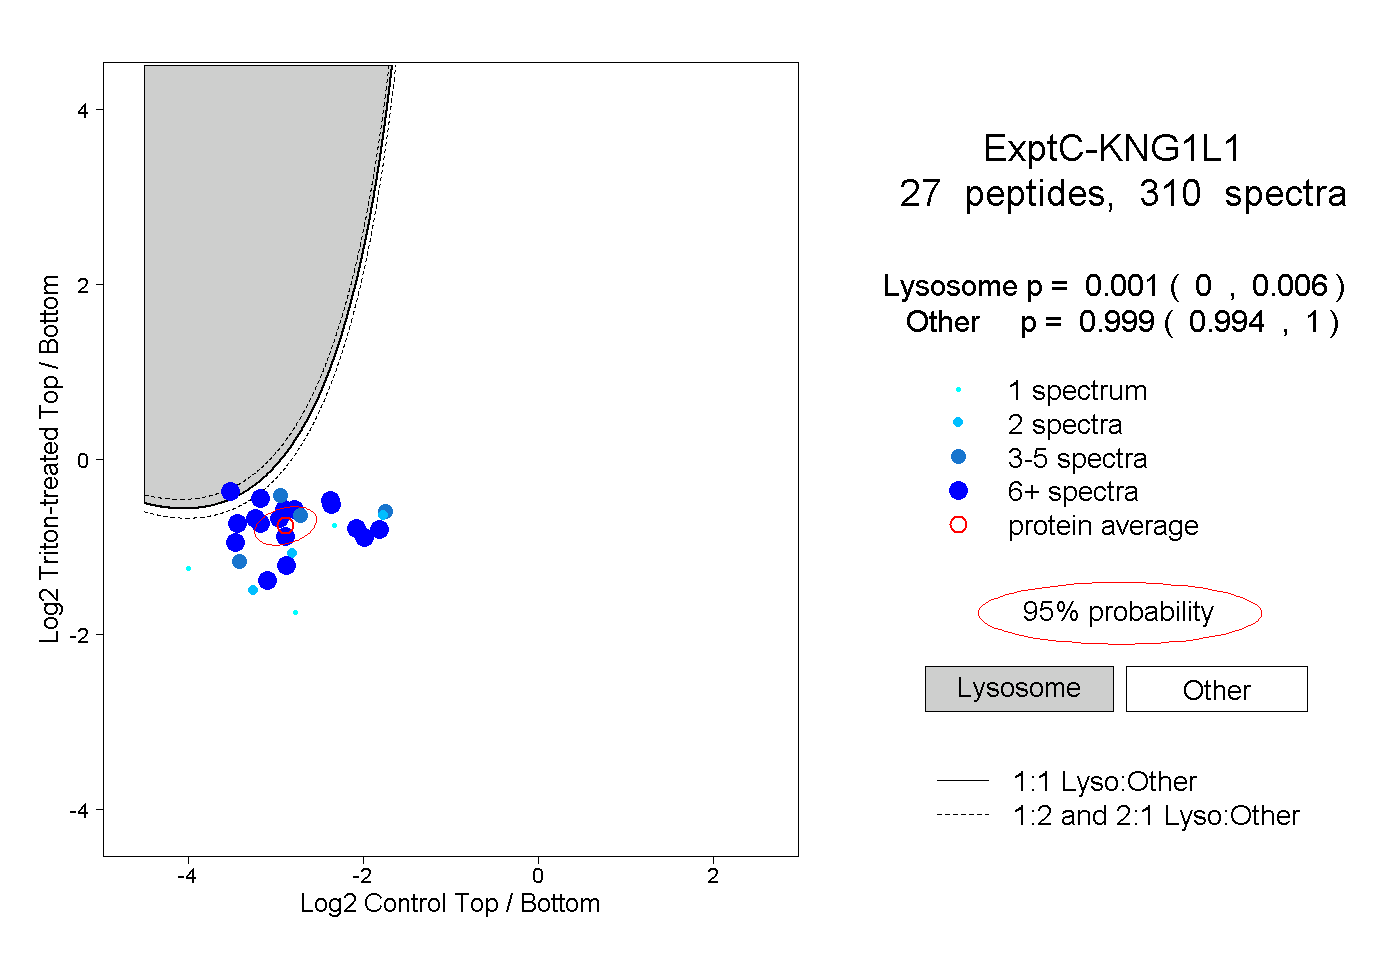
0.000 | 0.006
0.994 | 1.000
16peptides
spectra
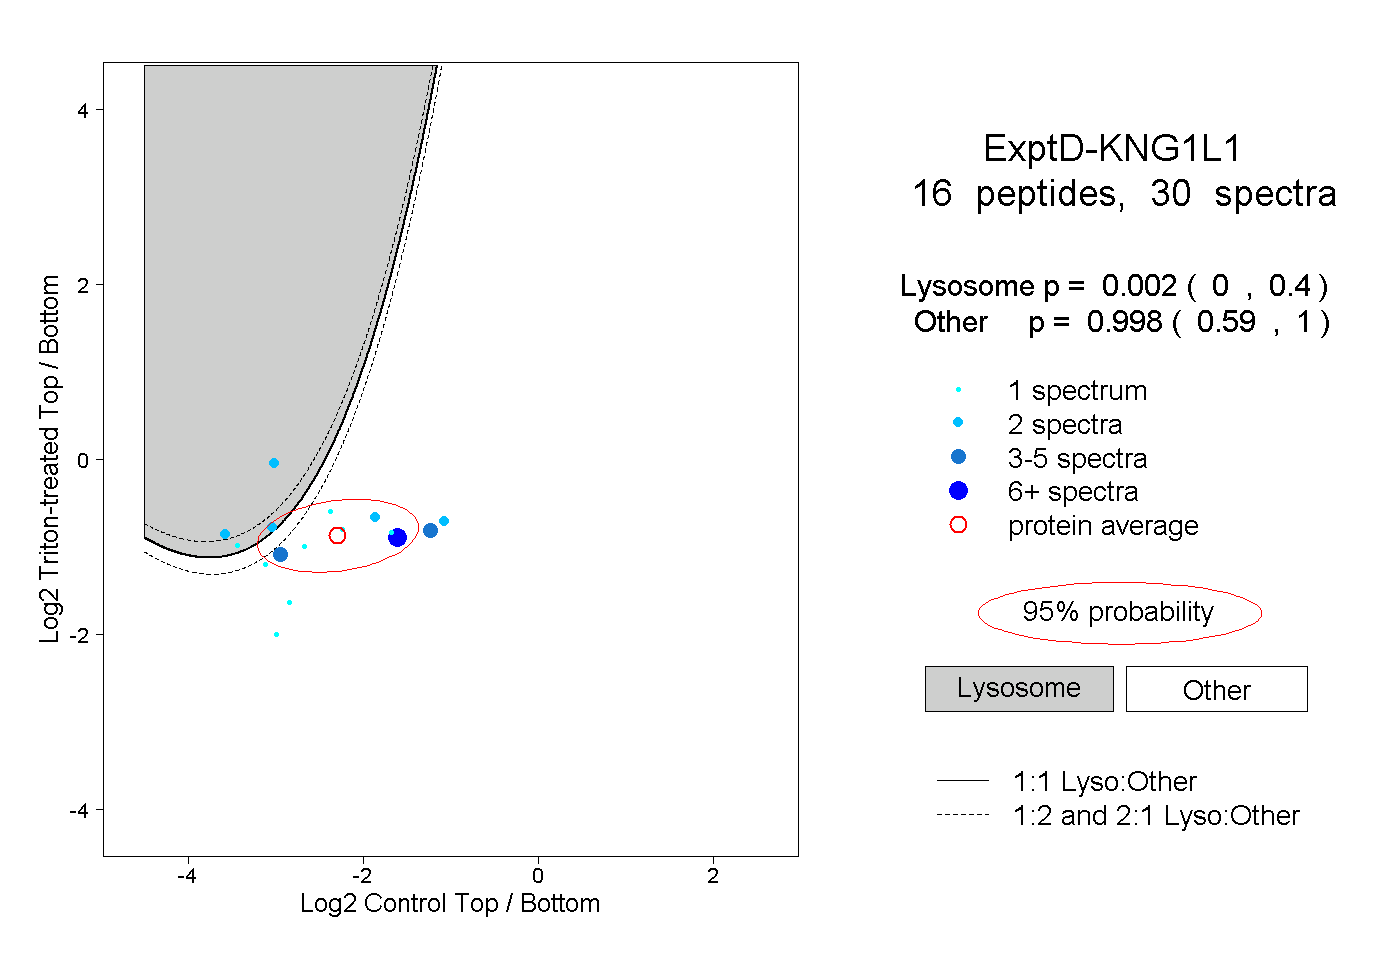
0.000 | 0.400
0.590 | 1.000