 12
12peptides
spectra
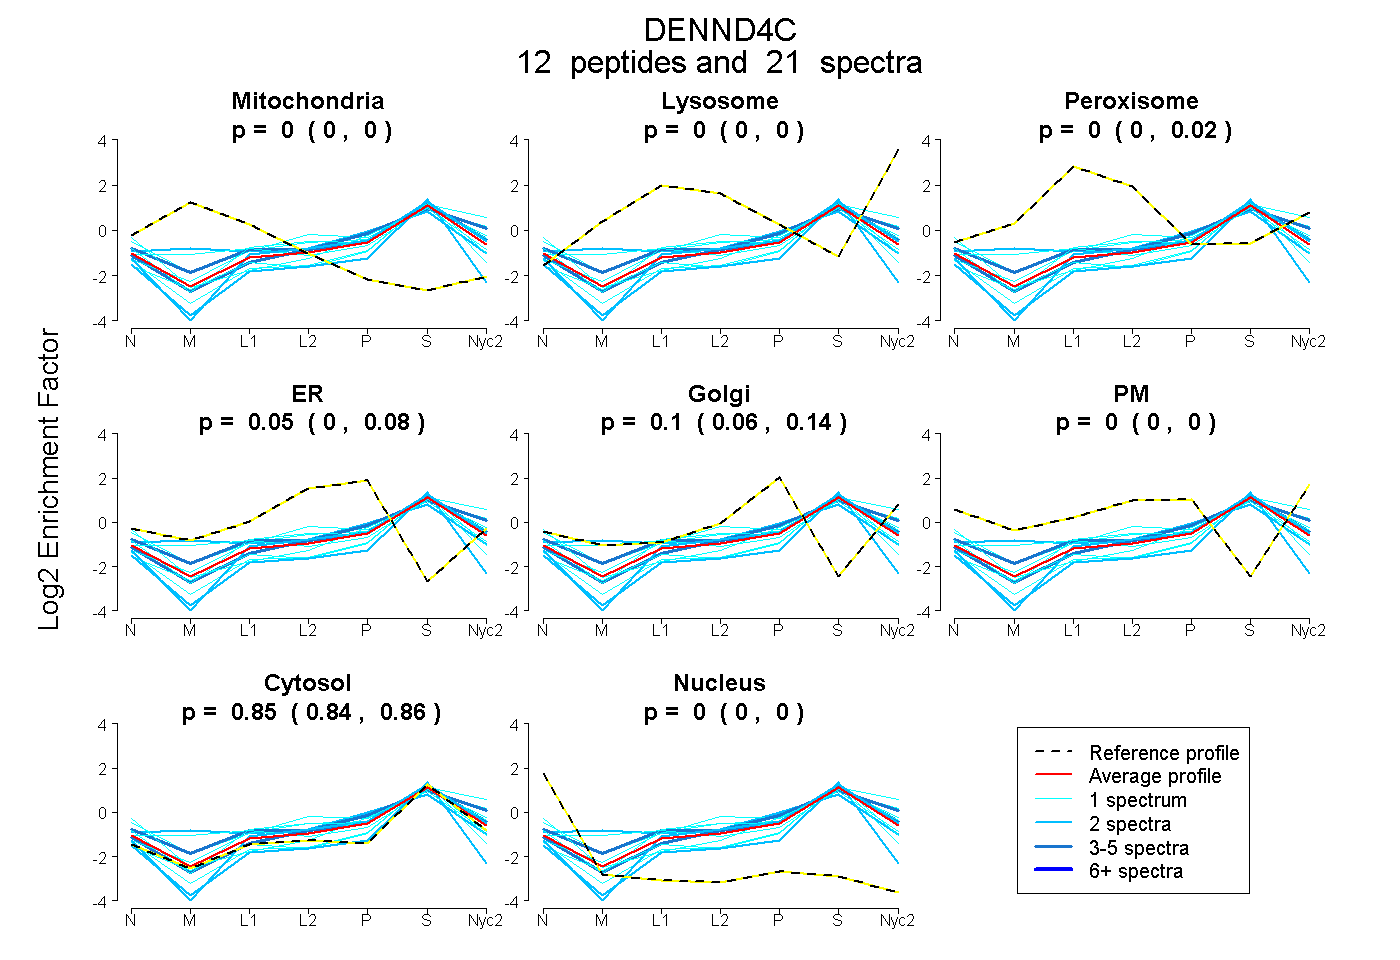
0.000 | 0.000
0.000 | 0.000
0.000 | 0.021
0.000 | 0.076
0.059 | 0.135
0.000 | 0.000
0.838 | 0.862
0.000 | 0.000
3peptides
spectra
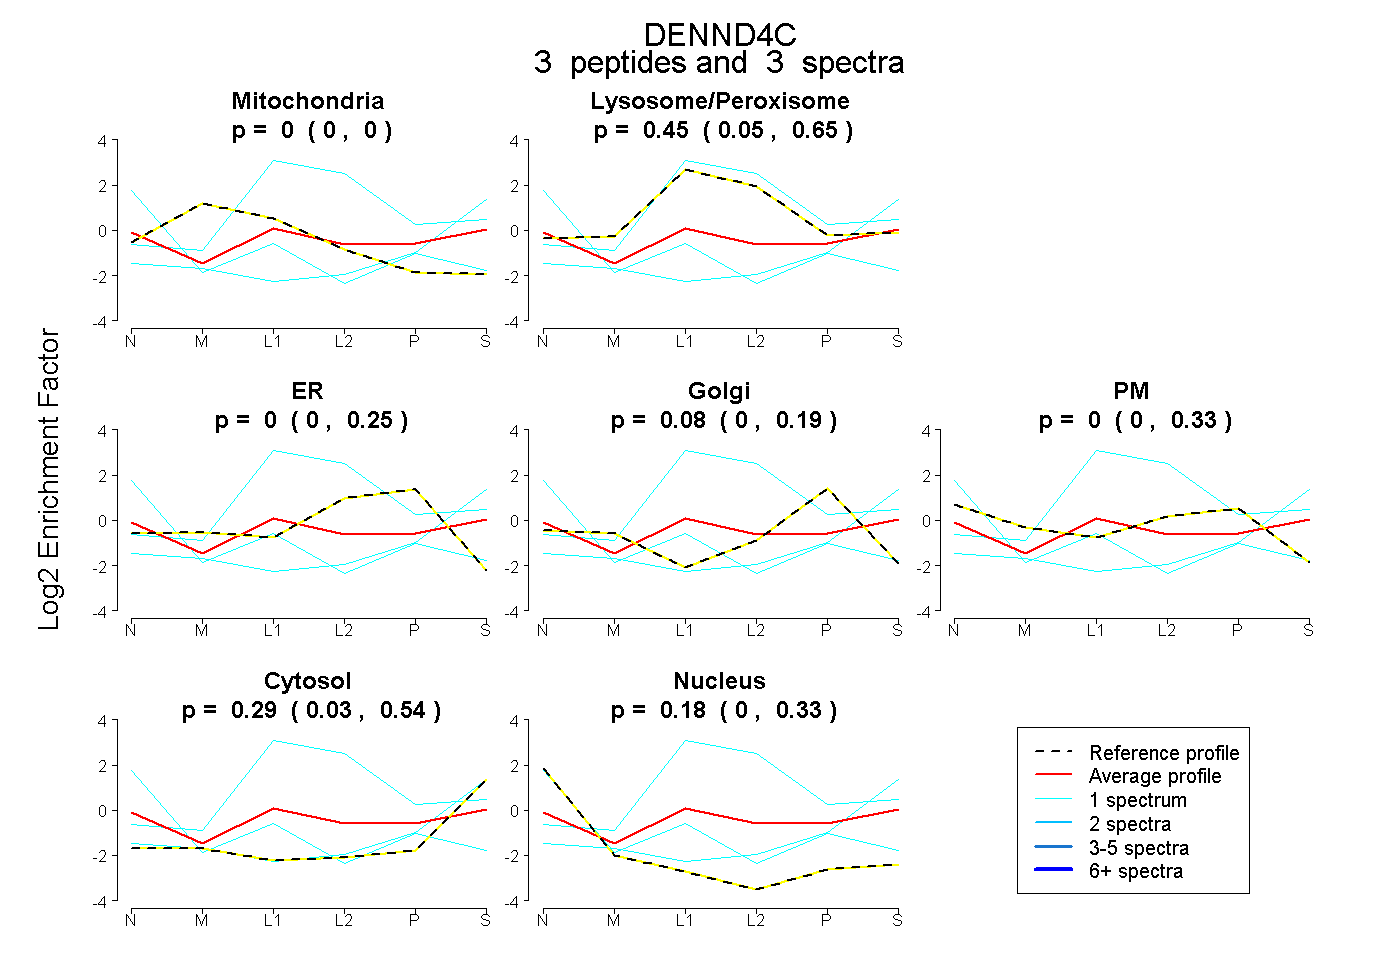
0.000 | 0.000
0.048 | 0.654
0.000 | 0.250
0.000 | 0.185
0.000 | 0.334
0.032 | 0.536
0.000 | 0.329
7peptides
spectra

0.000 | 1.000
0.000 | 1.000