11
11peptides
spectra
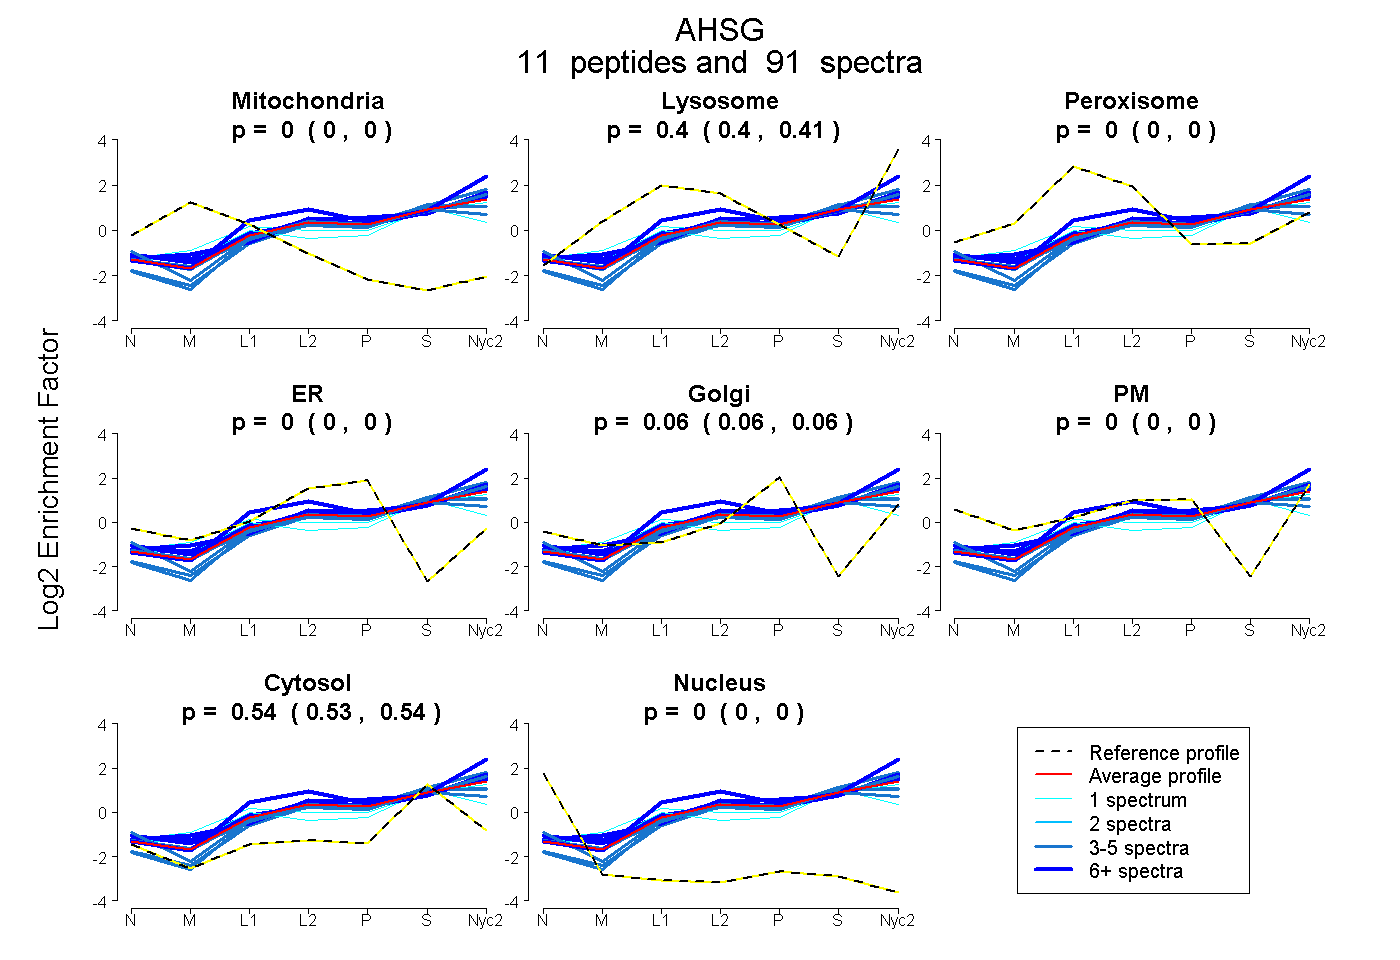
0.000 | 0.000
0.399 | 0.408
0.000 | 0.000
0.000 | 0.000
0.057 | 0.063
0.000 | 0.000
0.532 | 0.538
0.000 | 0.000
7peptides
spectra
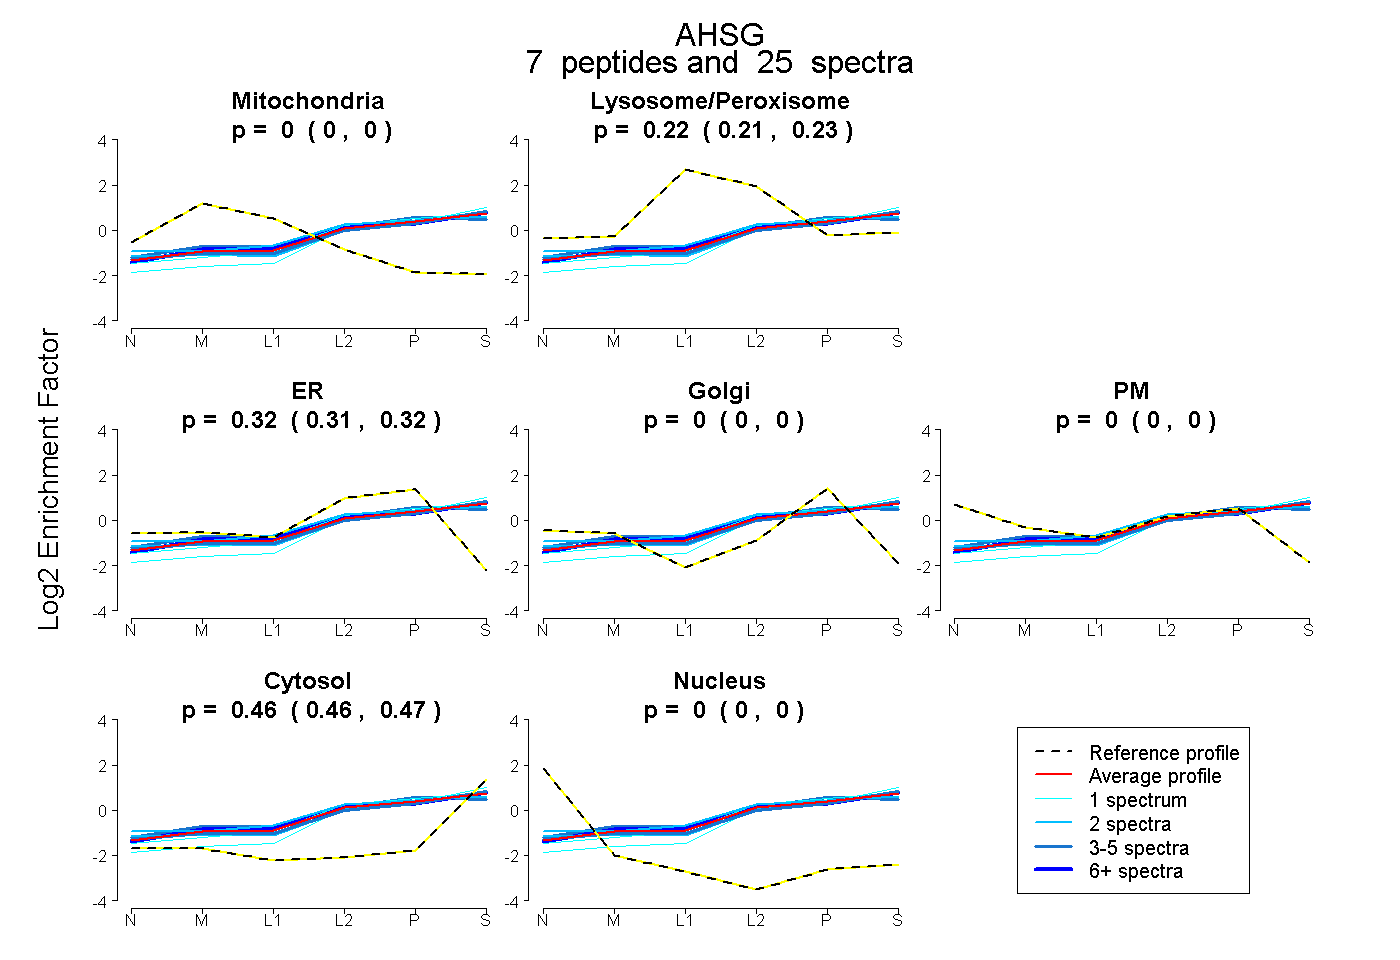
0.000 | 0.000
0.214 | 0.225
0.311 | 0.322
0.000 | 0.000
0.000 | 0.000
0.460 | 0.466
0.000 | 0.000